
4.1 Signal and Noise: Difference between revisions
More actions
// via Wikitext Extension for VSCode |
|||
| (21 intermediate revisions by the same user not shown) | |||
| Line 1: | Line 1: | ||
{{ | {{Cover|4.1 Signal and Noise}} | ||
To make sense of this complex world, how do we confidently identify a meaningful pattern amongst a myriad of distractions? Scientists call the pattern "signal" and the distractions "noise." We clarify this subtle distinction and introduce techniques to make the signal stand out from the noise, such as with the use of filters. | |||
== | == The Lesson in Context == | ||
<!-- Always begin section with a description of this lesson in relation to the course as a whole. --> | |||
We introduce the concept of signal and noise in "detection problems" and teach students how to identify the signal and various sources of noise in diverse scenarios. This foreshadows the [[5.1 False Positives and Negatives|ethical considerations in deciding how strong a signal must be to be counted as a "positive"]]. | |||
<!-- Expandable section relating this lesson to other lessons. --> | |||
{{Expand|Relation to Other Lessons| | |||
'''Earlier Lessons''' | |||
{{ContextLesson|2.2 Systematic and Statistical Uncertainty}} | |||
{{ContextRelation|Both systematic and statistical uncertainties introduce noise to every measurement.}} | |||
{{ContextLesson|3.1 Probabilistic Reasoning}} | |||
== | {{ContextRelation|The presence of noise, which sometimes disguises as a signal, is inevitable in any measurement. The identification of a signal always comes with a roughly quantifiable level of confidence.}} | ||
{{Line}} | |||
< | '''Later Lessons''' | ||
{{ContextLesson|4.2 Finding Patterns in Random Noise}} | |||
{{ContextRelation|In addition to the signal-to-noise ratio, there are other statistical tools (e.g. <math>p</math>-value) to quantify the strength of the signal amidst all the noise.}} | |||
{{ContextLesson|5.1 False Positives and Negatives}} | |||
{{ContextRelation|"Positive" and "negative" refer to whether we identify what we detect as a signal or not. The decision of any "threshold" of strength for a signal to be counted as positive inevitably involves human values judgment in a trade-off between the rates of false positives and false negatives.}} | |||
{{ContextLesson|5.2 Scientific Optimism}} | |||
{{ContextRelation|Some signals in nature seem hopelessly too weak to detect, such as the tiny fluctuations in the distance between two mirrors as a result of the gravitational waves from faraway black holes, but scientists spend decades to develop new instruments to increase the strength of the signal, as well as new analysis techniques to filter out the noise.}} | |||
{{ContextLesson|6.1 Correlation and Causation}} | |||
{{ContextRelation|The detection of a "statistically significant" difference between conditions in an RCT is the identification of a signal. The random variations that exist between experimental subjects are a source of noise.}} | |||
}} | |||
== Takeaways == | |||
<tabber> | |||
|-|Learning Goals= | |||
After this lesson, students should | After this lesson, students should | ||
<!-- Learning goals are written as a numbered list. --> | |||
# Be able to explain what scientists mean by "signal," "noise," and "signal-to-noise ratio." | # Be able to explain what scientists mean by "signal," "noise," and "signal-to-noise ratio." | ||
# Be able to identify examples of "signal" and "noise," recognizing that these examples are context-dependent. | # Be able to identify examples of "signal" and "noise," recognizing that these examples are context-dependent. | ||
# Be able to roughly compare measurement techniques in terms of their resultant signal-to-noise ratios. | # Be able to roughly compare measurement techniques in terms of their resultant signal-to-noise ratios. | ||
# Be able to describe examples of techniques and tools to suppress noise and/or amplify signal. | # Be able to describe examples of techniques and tools to suppress noise and/or amplify signal. | ||
|-|Definitions= | |||
<!-- Definitions must be written with the Definition and Subdefinition templates. The first Definition should have the "first=yes" flag at the end. --> | |||
{{Definition|Signal|Aspects of observations or stimuli that provide useful information about the target of interest, as opposed to noise.|first=yes}} | |||
{{BoxCaution|Please hold off on introducing the concept of false positive/negative or thresholds in detections, as students have previously been overwhelmed and confused. We will properly discuss them in [[5.1 False Positives and Negatives]].}} | |||
{{Definition|Noise|The aspects of observations that get confused with signal but do not provide the same useful information about the target of interest. Noise is frequently, but not always, the result of random measurement fluctuations.}} | |||
{{BoxCaution|Some students falsely think that noise is anything that prevents you from detecting the signal, for instance, a law banning the use of ultrasound to detect the sex of the foetus. In fact, noise is something that is detected by an instrument the same way a signal would be, except that it is not caused by the source of the signal and could be confused with the signal.}} | |||
{{BoxCaution|There is always random background noise. But, noise doesn't have to be random.}} | |||
{{BoxCaution|Noise does not have to be sound.}} | |||
{{Definition|Signal-to-noise Ratio|The relative strength of signal compared to the relative strength of noise in a given context. Obtaining meaningful information from the world requires distinguishing signal from noise. Therefore, human cognition (both scientific and otherwise) relies on techniques and tools to suppress noise and/or amplify signal (i.e., increase signal-to-noise ratio). It is possible to design filters to increase the signal-to-noise ratio, if you know where the noise is going to appear.}} | |||
<br /> | |||
= | |-|Examples= | ||
{{Example | |||
|Bajau People | |||
|As a member of the Bajau people of Southeast Asia, you are diving to collect shellfish for food. While the shellfish themselves are the signal, there are several sources of noise: rocks and other creatures resembling shellfish, waving sunlight patterns on the seafloor. The signal-to-noise ratio may be low if the water is murky (higher noise), the shellfish are camouflaged (lower signal), or if the light is dim (lower signal). | |||
|links={{LinkCard | |||
|url=https://www.bbc.com/news/science-environment-43823885 | |||
|title=The 'sea nomads' who free-dive for a living | |||
|description=BBC article on the Bajau people and diving.}} | |||
}} | |||
{{Example | |||
|Identifying Fish | |||
|Detecting fish jumps (signal) on a lake on a day when the wind is causing waves (noise). Some splashing waves may be misidentified as fish jumps.}} | |||
{{Example | |||
|Radio Static | |||
|Getting the words of a radio personality through static.}} | |||
{{Example | |||
|Loud Party | |||
|Hearing your conversational partner at a party where lots of conversations are happening.}} | |||
{{Example | |||
: | |Randomized Controlled Trials | ||
: | |Figuring out if there's a meaningful difference between the control condition and experimental condition in an RCT. Random fluctuations in the chosen experimental sample may cause a spurious difference between the two groups; this is a source of noise. | ||
|comments= | |||
{{BoxCaution|We will cover RCTs in detail in [[6.1 Correlation and Causation]].}} | |||
}} | |||
{{Example | |||
|Online Researching | |||
|Finding the facts on a topic where there's a lot of disinformation floating around.}} | |||
: | {{Example | ||
: | |Palate Cleansing | ||
|Palate cleansing with water or crackers between tasting different wines. The subtle differences between wines are the signal, while lingering flavours and scents from the previous wine are the noise.}} | |||
{{Example | |||
|COVID Symptom Screening | |||
: ''' | |The signal is the actual COVID infection, and the noise is all the other illnesses/allergies/etc causing similar symptoms.}} | ||
{{Example | |||
|Smoke Detectors | |||
|Smoke detectors detect the presence of smoke from a fire (signal) by measuring the opacity of air. Steam is a possible source of noise.}} | |||
{{Exemplary | |||
|{{Blockquote|It's hard to see the effect since there are so many other issues going on that act as noise, but there really appears to be a remarkable correlation between a young child's ability to defer gratification and later successes in life.}} | |||
{{Blockquote|The problem is that nowadays we are inundated with stories about every scary crime that happens anywhere in the world, so this "noise" confuses us and we can't see the striking "signal" that crime in our country has gone down dramatically in the past three decades.}} | |||
{{Blockquote|Any signal can count as noise, just like any noise can be considered as signal; it depends on what you're trying to see.}} | |||
{{Blockquote|An example from my landscape ecology course: for raster data, a bigger cell size/grain reduces the accuracy of the representation and makes it harder to determine the original landscape form.|[http://desktop.arcgis.com/en/arcmap/10.3/manage-data/raster-and-images/cell-size-of-raster-data.htm Source]}} | |||
{{Blockquote|On September 26, 1983, Lieutenant Stanislav Petrov of the Soviet Air Defense Forces was alerted to the launching of 5 American nuclear ICBMs. Instead of following protocol and recommending full-scale nuclear retaliation to his commanders, Petrov correctly realized the alert was a false alarm. The reflection of the sun off the tops of clouds had confused the Soviet satellite that triggered the alarm.|[https://www.nytimes.com/2018/01/13/us/false-alarm-missile-alerts.html Source]}} | |||
{{Blockquote|The signal is the truth. The noise is what distracts us from the truth.|[https://www.goodreads.com/work/quotes/19175796-the-signal-and-the-noise-why-so-many-predictions-fail---but-some-don-t Nate Silver, ''The Signal and the Noise: Why So Many Predictions Fail—But Some Don't'']}} | |||
{{Blockquote|Most of you will have heard the maxim "correlation does not imply causation." Just because two variables have a statistical relationship with each other does not mean that one is responsible for the other. For instance, ice cream sales and forest fires are correlated because both occur more often in the summer heat. But there is no causation; you don't light a patch of the Montana brush on fire when you buy a pint of Haagen-Dazs.|[https://www.goodreads.com/work/quotes/19175796-the-signal-and-the-noise-why-so-many-predictions-fail---but-some-don-t Nate Silver, ''The Signal and the Noise: Why So Many Predictions Fail—But Some Don't'']}} | |||
{{Blockquote|We compare USDA nutrient content data published in 1950 and 1999 for 13 nutrients and water in 43 garden crops, mostly vegetables. After adjusting for differences in moisture content, we calculate ratios of nutrient contents, R (1999/1950), for each food and nutrient. To evaluate the foods as a group, we calculate median and geometric mean <math>R</math>-values for the 13 nutrients and water. To evaluate <math>R</math>-values for individual foods and nutrients, with hypothetical confidence intervals, we use USDA's standard errors (SEs) of the 1999 values, from which we generate 2 estimates for the SEs of the 1950 values. As a group, the 43 foods show apparent, statistically reliable declines (<math>R < 1</math>) for 6 nutrients (protein, Ca, P, Fe, riboflavin and ascorbic acid), but no statistically reliable changes for 7 other nutrients. Declines in the medians range from 6% for protein to 38% for riboflavin. When evaluated for individual foods and nutrients, <math>R</math>-values are usually not distinguishable from 1 with current data. Depending on whether we use low or high estimates of the 1950 SEs, respectively 33% or 20% of the apparent <math>R</math>-values differ reliably from 1. Significantly, about 28% of these <math>R</math>-values exceed 1.|[https://www.tandfonline.com/doi/abs/10.1080/07315724.2004.10719409 Source]}} | |||
{{Blockquote|<math>p</math>-values and related analyses should not be reported selectively. Conducting multiple analyses of the data and reporting only those with certain <math>p</math>-values (typically those passing a significance threshold) renders the reported <math>p</math>-values essentially uninterpretable. Cherry-picking promising findings, also known by such terms as data dredging, significance chasing, significance questing, selective inference, and "<math>p</math>-hacking," leads to a spurious excess of statistically significant results in the published literature and should be vigorously avoided. One need not formally carry out multiple statistical tests for this problem to arise: Whenever a researcher chooses what to present based on statistical results, valid interpretation of those results is severely compromised if the reader is not informed of the choice and its basis. Researchers should disclose the number of hypotheses explored during the study, all data collection decisions, all statistical analyses conducted, and all <math>p</math>-values computed. Valid scientific conclusions based on <math>p</math>-values and related statistics cannot be drawn without at least knowing how many and which analyses were conducted, and how those analyses (including <math>p</math>-values) were selected for reporting.|[https://www.tandfonline.com/doi/full/10.1080/00031305.2016.1154108 Source]}} | |||
{{Blockquote|When visiting with family friends for their daughter's birthday, my mom's friend's husband, who is an accountant for a large company that was being bought out and had to do an audit of company value (worth about 500mil), was discussing how discrepancies (noise) below 150k do not need to be followed up on because they don't significantly impact the value of the company (signal) and would not affect the sale price of the company or the buyer's decision to purchase (the purpose of the audit).}} | |||
{{Blockquote|While looking at EKGs taken by the EKG reader/device attached to my mom's phone, sometimes her device would stop recording and say that the signal is "unreadable" (usually due to electrical interference). In EKGs, small discrepancies are treated as noise and can be disregarded, but once there are too many of them the signal cannot be determined.}} | |||
{{Blockquote|no seremos Los mismos, dejamos de serlo el día que el prImero partió. Buscando lo quE aquí nos arRebataron, esas Tonadas de alegría, paz. no seremos los mismos, tAmpoco quiero serlo. porque el recuerDo olvidado está. no somos los mismos. seremos mejores. #microcuento #24Ago — It was written mostly in all lower case. It would have been easy to miss the random letters he capitalized throughout the tweet: L-I-B-E-R-T-A-D.|[https://www.npr.org/2018/09/11/643722787/for-many-in-venezuela-social-media-is-a-matter-of-life-and-death Source]}} | |||
}} | |||
|-|Expanded Learning Goals= | |||
After this lesson, students should | |||
# Concept Acquisition | |||
## '''Signal:''' Aspects of observations or stimuli that provide useful information about the target of interest, as opposed to noise. | |||
## '''Noise:''' The aspects of observations or stimuli that distract from, dilute, or get confused with signal, and are not signal (i.e., do not provide useful information about the target of interest). | |||
### Noise is frequently, but not always, the result of random measurement fluctuations. | |||
## Observations/stimuli subject to confusion between signal and noise include communication, measurements, descriptions, etc. | |||
## '''Signal-to-Noise Ratio:''' The relative strength of signal compared to the relative strength of noise in a given context. Obtaining meaningful information from the world requires distinguishing signal from noise. Therefore, human cognition (both scientific and otherwise) relies on techniques and tools to suppress noise and/or amplify signal (i.e., increase the signal-to-noise ratio). | |||
# Concept Application | |||
## Identify examples of "signal" and "noise," recognizing that these examples are context-dependent. | |||
## Roughly compare measurement techniques in terms of their resultant signal-to-noise ratios. | |||
## Describe examples of techniques and tools to suppress noise and/or amplify signal (i.e., increase the signal-to-noise ratio). | |||
</tabber> | |||
{{#restricted:{{Private:4.1 Signal and Noise}}}} | |||
{{NavCard|chapter=Lesson plans|text=All lesson plans|prev=3.2 Calibration of Credence Levels|next=4.2 Finding Patterns in Random Noise}} | |||
# | |||
# | |||
# | |||
# ( | |||
# | |||
{{ | |||
[[Category:Lesson plans]] | [[Category:Lesson plans]] | ||
Latest revision as of 22:33, 11 June 2026
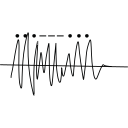
To make sense of this complex world, how do we confidently identify a meaningful pattern amongst a myriad of distractions? Scientists call the pattern "signal" and the distractions "noise." We clarify this subtle distinction and introduce techniques to make the signal stand out from the noise, such as with the use of filters.
The Lesson in Context
We introduce the concept of signal and noise in "detection problems" and teach students how to identify the signal and various sources of noise in diverse scenarios. This foreshadows the ethical considerations in deciding how strong a signal must be to be counted as a "positive".
Earlier Lessons

- Both systematic and statistical uncertainties introduce noise to every measurement.

- The presence of noise, which sometimes disguises as a signal, is inevitable in any measurement. The identification of a signal always comes with a roughly quantifiable level of confidence.
Later Lessons
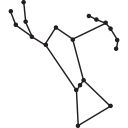
- In addition to the signal-to-noise ratio, there are other statistical tools (e.g. [math]\displaystyle{ p }[/math]-value) to quantify the strength of the signal amidst all the noise.

- "Positive" and "negative" refer to whether we identify what we detect as a signal or not. The decision of any "threshold" of strength for a signal to be counted as positive inevitably involves human values judgment in a trade-off between the rates of false positives and false negatives.

- Some signals in nature seem hopelessly too weak to detect, such as the tiny fluctuations in the distance between two mirrors as a result of the gravitational waves from faraway black holes, but scientists spend decades to develop new instruments to increase the strength of the signal, as well as new analysis techniques to filter out the noise.
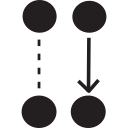
- The detection of a "statistically significant" difference between conditions in an RCT is the identification of a signal. The random variations that exist between experimental subjects are a source of noise.
Takeaways
After this lesson, students should
- Be able to explain what scientists mean by "signal," "noise," and "signal-to-noise ratio."
- Be able to identify examples of "signal" and "noise," recognizing that these examples are context-dependent.
- Be able to roughly compare measurement techniques in terms of their resultant signal-to-noise ratios.
- Be able to describe examples of techniques and tools to suppress noise and/or amplify signal.
Signal
Please hold off on introducing the concept of false positive/negative or thresholds in detections, as students have previously been overwhelmed and confused. We will properly discuss them in 5.1 False Positives and Negatives.
Noise
Some students falsely think that noise is anything that prevents you from detecting the signal, for instance, a law banning the use of ultrasound to detect the sex of the foetus. In fact, noise is something that is detected by an instrument the same way a signal would be, except that it is not caused by the source of the signal and could be confused with the signal.
There is always random background noise. But, noise doesn't have to be random.
Noise does not have to be sound.
Signal-to-noise Ratio
Bajau People
Identifying Fish
Radio Static
Loud Party
Randomized Controlled Trials
We will cover RCTs in detail in 6.1 Correlation and Causation.
Online Researching
Palate Cleansing
COVID Symptom Screening
Smoke Detectors
Exemplary Quotes
“It's hard to see the effect since there are so many other issues going on that act as noise, but there really appears to be a remarkable correlation between a young child's ability to defer gratification and later successes in life.”
“The problem is that nowadays we are inundated with stories about every scary crime that happens anywhere in the world, so this "noise" confuses us and we can't see the striking "signal" that crime in our country has gone down dramatically in the past three decades.”
“Any signal can count as noise, just like any noise can be considered as signal; it depends on what you're trying to see.”
“An example from my landscape ecology course: for raster data, a bigger cell size/grain reduces the accuracy of the representation and makes it harder to determine the original landscape form.”
“On September 26, 1983, Lieutenant Stanislav Petrov of the Soviet Air Defense Forces was alerted to the launching of 5 American nuclear ICBMs. Instead of following protocol and recommending full-scale nuclear retaliation to his commanders, Petrov correctly realized the alert was a false alarm. The reflection of the sun off the tops of clouds had confused the Soviet satellite that triggered the alarm.”
“The signal is the truth. The noise is what distracts us from the truth.”
“Most of you will have heard the maxim "correlation does not imply causation." Just because two variables have a statistical relationship with each other does not mean that one is responsible for the other. For instance, ice cream sales and forest fires are correlated because both occur more often in the summer heat. But there is no causation; you don't light a patch of the Montana brush on fire when you buy a pint of Haagen-Dazs.”
“We compare USDA nutrient content data published in 1950 and 1999 for 13 nutrients and water in 43 garden crops, mostly vegetables. After adjusting for differences in moisture content, we calculate ratios of nutrient contents, R (1999/1950), for each food and nutrient. To evaluate the foods as a group, we calculate median and geometric mean [math]\displaystyle{ R }[/math]-values for the 13 nutrients and water. To evaluate [math]\displaystyle{ R }[/math]-values for individual foods and nutrients, with hypothetical confidence intervals, we use USDA's standard errors (SEs) of the 1999 values, from which we generate 2 estimates for the SEs of the 1950 values. As a group, the 43 foods show apparent, statistically reliable declines ([math]\displaystyle{ R < 1 }[/math]) for 6 nutrients (protein, Ca, P, Fe, riboflavin and ascorbic acid), but no statistically reliable changes for 7 other nutrients. Declines in the medians range from 6% for protein to 38% for riboflavin. When evaluated for individual foods and nutrients, [math]\displaystyle{ R }[/math]-values are usually not distinguishable from 1 with current data. Depending on whether we use low or high estimates of the 1950 SEs, respectively 33% or 20% of the apparent [math]\displaystyle{ R }[/math]-values differ reliably from 1. Significantly, about 28% of these [math]\displaystyle{ R }[/math]-values exceed 1.”
“[math]\displaystyle{ p }[/math]-values and related analyses should not be reported selectively. Conducting multiple analyses of the data and reporting only those with certain [math]\displaystyle{ p }[/math]-values (typically those passing a significance threshold) renders the reported [math]\displaystyle{ p }[/math]-values essentially uninterpretable. Cherry-picking promising findings, also known by such terms as data dredging, significance chasing, significance questing, selective inference, and "[math]\displaystyle{ p }[/math]-hacking," leads to a spurious excess of statistically significant results in the published literature and should be vigorously avoided. One need not formally carry out multiple statistical tests for this problem to arise: Whenever a researcher chooses what to present based on statistical results, valid interpretation of those results is severely compromised if the reader is not informed of the choice and its basis. Researchers should disclose the number of hypotheses explored during the study, all data collection decisions, all statistical analyses conducted, and all [math]\displaystyle{ p }[/math]-values computed. Valid scientific conclusions based on [math]\displaystyle{ p }[/math]-values and related statistics cannot be drawn without at least knowing how many and which analyses were conducted, and how those analyses (including [math]\displaystyle{ p }[/math]-values) were selected for reporting.”
“When visiting with family friends for their daughter's birthday, my mom's friend's husband, who is an accountant for a large company that was being bought out and had to do an audit of company value (worth about 500mil), was discussing how discrepancies (noise) below 150k do not need to be followed up on because they don't significantly impact the value of the company (signal) and would not affect the sale price of the company or the buyer's decision to purchase (the purpose of the audit).”
“While looking at EKGs taken by the EKG reader/device attached to my mom's phone, sometimes her device would stop recording and say that the signal is "unreadable" (usually due to electrical interference). In EKGs, small discrepancies are treated as noise and can be disregarded, but once there are too many of them the signal cannot be determined.”
“no seremos Los mismos, dejamos de serlo el día que el prImero partió. Buscando lo quE aquí nos arRebataron, esas Tonadas de alegría, paz. no seremos los mismos, tAmpoco quiero serlo. porque el recuerDo olvidado está. no somos los mismos. seremos mejores. #microcuento #24Ago — It was written mostly in all lower case. It would have been easy to miss the random letters he capitalized throughout the tweet: L-I-B-E-R-T-A-D.”
After this lesson, students should
- Concept Acquisition
- Signal: Aspects of observations or stimuli that provide useful information about the target of interest, as opposed to noise.
- Noise: The aspects of observations or stimuli that distract from, dilute, or get confused with signal, and are not signal (i.e., do not provide useful information about the target of interest).
- Noise is frequently, but not always, the result of random measurement fluctuations.
- Observations/stimuli subject to confusion between signal and noise include communication, measurements, descriptions, etc.
- Signal-to-Noise Ratio: The relative strength of signal compared to the relative strength of noise in a given context. Obtaining meaningful information from the world requires distinguishing signal from noise. Therefore, human cognition (both scientific and otherwise) relies on techniques and tools to suppress noise and/or amplify signal (i.e., increase the signal-to-noise ratio).
- Concept Application
- Identify examples of "signal" and "noise," recognizing that these examples are context-dependent.
- Roughly compare measurement techniques in terms of their resultant signal-to-noise ratios.
- Describe examples of techniques and tools to suppress noise and/or amplify signal (i.e., increase the signal-to-noise ratio).
Additional Content
You must be logged in to see this content.