
Quiz questions: Difference between revisions
More actions
// Edit via Wikitext Extension for VSCode |
// Edit via Wikitext Extension for VSCode |
||
| Line 2,106: | Line 2,106: | ||
== 14.2 Wrap Up == | == 14.2 Wrap Up == | ||
wut | wut? | ||
{{BoxTip|This lesson is not explicitly tested on.}}{{NavCard|prev=Decision Poster Project|next=Main Page}} | {{BoxTip|This lesson is not explicitly tested on.}}{{NavCard|prev=Decision Poster Project|next=Main Page}} | ||
[[Category:Reference]] | [[Category:Reference]] | ||
Revision as of 11:55, 22 August 2023
A bank of previously used exam, quiz, and practice questions.
These questions are compiled from many different iterations of the course. Some of them address topics that are not currently emphasized.
1.1 Introduction and When Is Science Relevant
Climate change forum
Relevant topic(s): 1.1 Introduction and When Is Science Relevant
In an international forum on climate change, the following statements are made by various parties across the globe. Identify if each of these statements is a claim of fact or a claim of value.
- Leader of a major first world country: "The current change in global climate is not caused by human industrial activity." (Fact/Value)
In 2022, 80% of students got this right. In 2023, 95% of students got this right. - A climate activist: "A world whose economy is built around environmental consciousness rather than corporate greed is a world that's worth living in." (Fact/Value)
In 2023, 100% of students got this right. In 2022, 100% of students got this right. - An economist: "By my conservative estimate, the clean energy sector will create 1 million jobs within the next two years." (Fact/Value)
In 2022, 95% of students got this right. In 2023, 96% of students got this right. - An industry lobbyist: "More than half the population would prioritize maintaining job security over reducing the risks of climate change." (Fact/Value)
In 2022, 65% of students got this right. In 2023, 74% of students got this right.
Sugar tax
Relevant topic(s): 1.1 Introduction and When Is Science Relevant
There is a debate over whether a "sugar tax" should be imposed on high-sugar soft drinks to reduce obesity, where the tax revenue would be used for healthy school lunch programs. In a town hall meeting on the issue, the following statements are made. Identify whether each of these is a claim of fact or a claim of value.
- A concerned parent: "I'm pretty sure that people will stop drinking soft drinks altogether if you tax them." (Fact/Value)
Fact. The parent is expressing her confidence that soda consumption will stop if you tax them. This is a statement of fact, albeit a potentially incorrect fact! However, it is able to be falsified and there is a correct answer which can be addressed/validated through properly designed experiment. The key here is identifying that people can make "statements of fact" which are not correct. They are stating an "objective" reality which is not true, but we can test these statements and come up with an alternative fact which is either more or less true ( keeping in mind that every truth is not ABSOLUTE, but rather, more probable statement than the others given current data and methods!). - A school teacher: "Reducing children's access to soft drinks and investing tax revenue in school lunch programmes will greatly improve their lives." (Fact/Value)
Value. While this statement "could" potentially become fact, if we had a universal and or broadly accepted definition for "improved lives" (maybe lie expectancy, validated mental health measures, some of the metrics they use to measure "happiest" countries, reduced risk of preventable/non communicable disease) upon which to base a study that experimentally/causally linked reduced sugar intake to BOTH taxing drinks AND these positive outcomes, then this statement could become a fact. However "reasonable" the value seems, it still is a value because currently there is no objective measure of "what betters/improves a life" AND the teacher does not have proof that even if there were such a measure, it could be causally manipulated by sugar reduction. - A social scientist: "A sugar tax does seem to decrease consumption of sugar sweetened beverages, but the impact is not significant and requires further study." (Fact/Value)
Fact. The scientist has done studies but they are currently inconclusive as to the relationship between taxation and consumption. She is agnostic as to the value of either taxation or consumption. - A free market advocate: "In issues of public health and human rights, leaving the market free is almost always the best approach." (Fact/Value)
Value. There is no objective measure of what is "best." Additionally, given the claim that free markets are "best" for public health and human rights. They would need to show evidence that free market policies and practices are causally linked to broadly accepted metrics of positive markers for public health or human rights (given there is no currently accepted universal bill of human rights, and different societies define public health standards differently this can also be a grey area). - A convenience store owner: "If you raise taxes on my store, I won't be able to afford the heavy rent and will go out of business." (Fact/Value)
Fact. The store owner knows what his costs are. He knows the price of each item and what they sell for currently as well as what normally sells. He is stating a fact, though maybe not based in proof, and may not be true in the end. His statement is that he cannot pay store costs if there are more fees. He states what he thinks the outcome will be (without opinion or judgement). This can be proved true or false later, if we can 1) connect increased soda tax to decreased consumption and 2) connect this decrease in consumption to the amount of money needed to keep his store running 3) if it were ethical...watch his store go out of business, versus make a projected model of the outcome.
Political facts and values
Relevant topic(s): 1.1 Introduction and When Is Science Relevant
For each statement, identify whether it is primarily a statement of fact or a statement of value:
- From a candidate for Governor of California: "Lowering taxes will greatly improve the well-being of all Californians!" (Fact/Value)
In 2022, 89% of students got this right. - "Even though the United States does not have universal healthcare, it spends more on healthcare than any other country." (Fact/Value)
In 2022, 99% of students got this right. - "Despite its flaws, a free market economy is almost always the best approach." (Fact/Value)
In 2022, 98% of students got this right.
Democracy and epistocracy
Relevant topic(s): 1.1 Introduction and When Is Science Relevant
Which of the following statements is the best example of an epistocracy?
- City council where 10 council members are elected by residents of the city.
- A local Parent Teacher Association raises a large portion of a school's funds, and therefore has power in choosing which programs are funded.
- The University of California Board of Regents, appointed by the Governor of California, are frequently lawyers, politicians, and business-people who have donated large sums to the Governor's election campaign.
- A city bases its COVID-19 mitigation efforts on reports from the CDC and NIH.
| In 2022, 65% of students got this right. |
International GMO forum
Relevant topic(s): 1.1 Introduction and When Is Science Relevant
The following statements are made by various interested parties at an international forum on GMOs (genetically modified organisms). Identify if each of these statements is a claim of fact or a claim of value.
- Farmer 1: "My organic and non-GMO produce is the best local food you can buy!" (Fact/Value)
In 2023, 93% of students got this right. - Farmer 2: "By planting GMOs, I am reducing the amount of pesticides in the food that I sell." (Fact/Value)
In 2023, 98% of students got this right. - Karen: "If I found someone feeding my children GMO products, I would immediately have a heart attack and die." (Fact/Value)
In 2023, 53% of students got this right. - A food scientist: "Studies show that children who consume GMO products have a higher chance of having a deathly allergic reaction than those who only consume non-GMO products." (Fact/Value)
In 2023, 99% of students got this right. - A world hunger advocate: he most important approach for reducing world hunger is widespread usage of GMOs. (Fact/Value)
In 2023, 91% of students got this right. - An environmental activist: "A majority of GMO users prioritize innovation in new crops over biodiversity" (Fact/Value)
In 2023, 89% of students got this right.
Kung Pao chicken
Relevant topic(s): 1.2 Shared Reality and Modeling
Sarah, an American, and Jieqing, an international student from Sichuan Province, China, are in a lively debate over what goes inside their favorite Chinese dish, Kung Pao Chicken. Sarah says that Kung Pao Chicken must be sweet and sour, while Jieqiing argues that the real Kung Pao Chicken must be spicy and contains lots of peppercorn. Here, is the definition of Kung Pao Chicken
- a realist one, or
- a conventionalist one?
Supplanting other models
Relevant topic(s): 1.2 Shared Reality and Modeling
Give an example of a model that has been supplanted by another model but still remains in some way useful. In what way has the new model superseded the old?
| Newtonian gravity remaining computationally useful for many problems despite being superseded by general relativity. Many other cases exist. |
Is caring sharing?
Relevant topic(s): 1.2 Shared Reality and Modeling
Which of the following would NOT be considered a part of our shared reality?
- Whether vaccines cause autism
- Whether it's better to be politically liberal or conservative
- Whether human activities are the leading cause of climate change
- Whether extraterrestrial life exists
| In 2022, 69% of students got this right. |
| In 2023, 60% of students got this right. |
Genetic engineering conference
Relevant topic(s): 1.2 Shared Reality and Modeling
At a conference on genetic engineering, two panelists, Dr. Hallstein and Dr. Yamazawa, are having a heated debate over the effectiveness of gene editing of mosquitos in reducing the spread of malaria. Dr. Hallstein thinks the approach can drastically reduce disease spread, whereas Dr. Yamazawa argues that it has negligible effect. How can the attendees of the conference decide who is correct in reality? Choose one.
- They cannot. Both panelists are correct to themselves, and they should agree to disagree.
- The attendees should take a vote. The claim receiving more than 50% of the votes is the correct one.
- They should defer to the most reputable senior scientist at the conference.
- They cannot yet, but they can continue to gather more evidence to see which opinion is more likely to be correct.
| In 2022, 97% of students got this right. |
Features of models
Relevant topic(s): 1.2 Shared Reality and Modeling
For each of the following, select whether the statement is true or false.
- When choosing among models, you should always use the model that is most complete. (True/False)
In 2023, 80% of students got this right. - When model A represents reality more accurately than model B, model B has been made redundant and should fall out of use. (True/False)
In 2023, 95% of students got this right. - All scientific knowledge is provisional. (True/False)
In 2023, 99% of students got this right. - When modeling a natural phenomenon, it is necessary to make simplifications. (True/False)
In 2023, 97% of students got this right.
Personalized truth
Relevant topic(s): 1.2 Shared Reality and Modeling
Consider the following quote:
"When people disagree about facts, you should never say one person is wrong because each person has their own truth that's true for them.
Give a concrete example in which this line of thinking may cause a bad outcome.
| Any case where it will lead you into a contradiction with the world. For example, disagreeing about the edge of a cliff and walking off of it. |
| In 2023, 84% of students got this right. |
2.1 Senses and Instrumentation
Is sound real?
Relevant topic(s): 2.1 Senses and Instrumentation
Robbie has just discovered a spectrograph app, which purportedly displays the "components" of sound in the environment in real time as various colors on his smartphone screen. His friend, Haowen, is very skeptical of this app and claims to Robbie that the app displays random colors just to look pretty, with no connection to the phenomenon of sound in the real world. In the context of interactive exploration, what can Robbie do to convince Haowen that the spectrograph app really is measuring something real about sound?
| The key here is "interactivity" which in turn brings "experiments" and "repeatability." For example, Robbie could show Haowen that every time he whistles there's a single tone but that it isn't there upon speaking or making some other sounds. |
Is mayonnaise an instrument?
Relevant topic(s): 2.1 Senses and Instrumentation
- List two instruments for perception that you use regularly, which extend your observation beyond direct perception through your senses. State both the instruments and the thing(s) they are measuring.
Correct: Binoculars, eyeglasses, hearing aids, carbon monoxide detector, thermometer, lab notebook (to extend memory of all past measurements), etc.
Incorrect: iPhone (without specifying the camera or microphone, etc), Pokemon Go, the Bible (can't be used to interact with world)In 2022, 95% of students got this right. In 2023, 83% of students got this right. The part about what the instrument was measuring was added in 2023. - Choose one instrument from the two you wrote above. By making reference to the concept of interactive exploration (as described by Ian Hacking in the reading about instrumentation), give one reason why you trust it.
Correct: I can look at various things around me, near and far, using binoculars/eyeglasses and compare the images with what I see with my own eyes. The immediate correspondence is a very visceral feeling.
I can place a thermometer into various things, hot or cold, and see its level go up or down. The immediate response and correspondence with my own sense of touch give a feeling of reality.
Incorrect: Read the user manual containing all the technical info and descriptions of the underlying mechanism.This problem is trying to get at the immediate visceral feedback one gets when testing the instrument in an interactive way, and how that feeling of immediacy helps us trust that the instrument at least measures something real in the world. In 2022, 89% of students got this right. In 2023, 69% of students got this right. - List one possible problem that could cause this instrument to lead you awry. Explain briefly how you would know that it misled you about reality.
The lenses could have a smudge on them or make straight lines curved. This can be found out by comparing with another pair of binoculars/eyeglasses or by seeing with my own eyes by walking closer to the subject.
The thermometer could have incorrect markings, so that 90° is not actually 90° in the real world. This can be found out by using many other thermometers to compare the readings, or see that by dipping in ice water, it somehow doesn't show 0°C.In 2022, 87% of students got this right.
Close encounters of the third kind
Relevant topic(s): 2.1 Senses and Instrumentation
You're casually walking down Telegraph Avenue when you bump into an alien from a different planet. It turns out that they don't have ears to hear sounds, but do have eyes to see. What is an instrument you could give them to show that sounds exist, and how could they use interactive exploration to confirm that sounds are indeed real and not suspicious human trickery?
| Reasonable Instruments: Spectrogram, microphone with volume indicator, etc. Reasonable Explanations: Making sounds in different ways and seeing immediate responses from the instrument, etc. |
iPhone intensity
Relevant topic(s): 2.1 Senses and Instrumentation
An iPhone app says it records the spectral intensity of light that is emitted from any light source. In other words, the instrument reads out which wavelengths of light are present, and what intensity each one is shining at. You are convinced that the makers of the app love the color red, because every light source you point the app at seems to have high levels of red wavelengths.
How could you validate whether the app is giving you correct readings of light?
Example Acceptable Answers:
|
Testing pH
Relevant topic(s): 2.1 Senses and Instrumentation
In your favorite science class at UC Berkeley you are given a totally novel device that claims to accurately measure water's pH level. For a fun Saturday morning activity, you test several samples of water from around Berkeley campus and notice that the device consistently reads a pH level that is lower than tap water (meaning it is more acidic than tap water). What is the best approach you could take to validate whether the device is giving you accurate readings of pH?
- Test the device on the campus water samples over the course of multiple weeks.
- Test the device on the campus water samples and compare the readings with a thermometer to see if there is a correlation.
- Test the device with samples with a range of expected pH levels and compare the readings with a standard pH meter and pH paper.
- Test whether plants that grow in higher pH soil are happy when you water them using the different water samples compared to tap water.
- Ignore the device's readings and use a standard pH meter instead.
| In 2023, 97% of students got this right. |
2.2 Systematic and Statistical Uncertainty
Unhappy university students
Relevant topic(s): 2.2 Systematic and Statistical Uncertainty
Priyanka, a high school student, wants to apply to Stanford University, but she first wants to find out if students at Stanford are generally happy or unhappy. She visits the campus (this was way before the pandemic) and asks the first three students she meets at the main entrance to the campus, "on a scale from 1 to 10, 10 being the happiest, how happy would you rate your life at Stanford?" The answers she gets are 8, 9, and 3. She concludes that Stanford students are generally happy to be there and decides to submit an application.
What is the primary source of uncertainty in Priyanka's polling of Stanford students' happiness?
- Statistical uncertainty
- Systematic uncertainty
For the answer that you chose, briefly describe one way to reduce this uncertainty.
| We know/assume that the students are being drawn at random, because Priyanka is standing at the main entrance which presumably all the students walk through to get to class.
So she is doing a good job to get an unbiased/random sample of the Stanford students BUT as you all mention, she only has 3 students, and from these three, we can already see there is variance and diversity in the responses and experiences. She needs to ask more students to get a true sense what the "average" experience is. Just as we see with coin tosses, with 2-3 tosses you can easily get heads all 3 times with a perfectly fair coin. To see that the coin is in fact 1 side heads and 1 side tails, with equal weighting to fall on either, we need many many flips! Over many trials we see a 50 percent heads and tails ratio, but with just 3, our experience of the potential outcomes for that coin are very skewed! Additionally, great job noticing that since she is only concerned with the experience of Stanford students, it is not biased in any way to only sample from the Stanford campus. There is no systematic bias here, since she only wants to extrapolate her findings to the experience at Stanford. If instead she wanted to know if college students in general are happy then her study would have. both statistical and systematic errors! She would have both a SMALL sample and a BIASED population she was drawing from! This is a really important part of scientific experiments! You have to define what question you are trying to answer to determine what errors are in your experimental process and how that can effect the final statements you make! Even if she were to gather many people at Stanford, if you then used this information to say ALL students have a good experience or a bad experience in college this would be an incorrect extension of her findings! This is why it is so important to know how to look at the methods and data sections of studies, so you can decide if they data collected and the statements made align! |
Systematic or statistical?
Relevant topic(s): 2.2 Systematic and Statistical Uncertainty
For each of the following measurements, state whether the biggest source of uncertainty is likely to be statistical or systematic.
- Measuring the average wind speed of Berkeley by averaging the readings from 100 wind speed gauges placed along the Berkeley coast. (Systematic/Statistical)
In 2022, 58% of students got this right. - Estimating the eventual percentage of votes for each of the 5 candidates for the city council by calling 2,000 random voters over the phone, reading the 5 candidates' names in the same order, and then asking each voter who they would vote for. (Systematic/Statistical)
In 2022, 83% of students got this right. - Determining your friend's favorite musical genre by shuffling the hundreds of "liked songs" in her music library and seeing which genre comes up the most in the first 5 songs. (Systematic/Statistical)
In 2022, 76% of students got this right.
Sleep studies
Relevant topic(s): 2.2 Systematic and Statistical Uncertainty
Many psychological studies are performed on university undergraduates who volunteer as experimental subjects in exchange for academic credit or cash. Suppose one such study attempts to measure the average amount of sleep humans have per week by asking 10 random students on Sproul Plaza to recall their sleep times in the past week.
- Name one source of systematic uncertainty in such a measurement.
Correct: University students are a very skewed sample of humans. They tend to be more sleep deprived than the general population. The average amount of sleep for humans is likely to be underestimated.
University students are younger, and they need more sleep than old people. The average amount of sleep for humans is likely to be overestimated.
The "past week" may have been finals week, when students are generally studying hard and being sleep deprived, lowering the estimate.
Incorrect: 10 participants is too few. Students may not remember their sleep time (unless they specifically suggest students always over/underestimate their sleep time).In 2022, 100% of students got this right. - How would you improve the study to reduce this systematic uncertainty?
Correct: Instead of asking random students on Sproul, ask university staff and faculty as well. Find experimental subjects not just from universities, but in the general public, across ages and occupations.
Incorrect: Increase sample size/ask more people (unless the explicitly say ask more diverse people)In 2022, 100% of students got this right.
Best example
Relevant topic(s): 2.2 Systematic and Statistical Uncertainty
Which of the following is the best example of systematic uncertainty (as opposed to statistical uncertainty)?
- You are comparing the apparent brightness of two stars. When taking your measurements, there are natural fluctuations of brightness due to "twinkling" caused by natural fluctuations in the atmosphere.
- The "average" height of a 25-year-old man in the US based on measuring a random sample of one hundred 25-year-old men in the US.
- Estimating the eventual percentage of votes for each of the 5 candidates for the city council by calling 2,000 random voters over the phone, reading the 5 candidates' names in the same order, and then asking each voter who they would vote for.
- Determining your friend's favorite musical genre by shuffling the hundreds of "liked songs" in her music library and seeing which genre comes up the most in the first 5 songs.
| In 2022, 73% of students got this right. |
| In 2023, 65% of students got this right. |
Local POLLatics
Relevant topic(s): 2.2 Systematic and Statistical Uncertainty
A new polling firm is trying to reduce uncertainty in polling for local elections. For each polling method, name a potential source of statistical and systematic error.
- In-depth focus groups where researchers ask participants to deliberate on single issues.
Statistical: Small sample size.
Systematic: The type of person who can come in for a focus group is not representative.In 2023, 76% of students got this right. - Random number dialing using the area code as a proxy for locality to ask about candidate support.
Statistical: Very few people will answer the phone.
Systematic: Cell phone area code is a bad proxy for location these days. Certain types of people own home phones.In 2023, 64% of students got this right.
Berkeley Rent Board
Relevant topic(s): 2.2 Systematic and Statistical Uncertainty
The Berkeley Rent Board wants to know how long it typically takes for repairs to be done by the landlord. They take a random sample of rental units in Berkeley. They first measure this by calling up the tenants. Then they take another measurement by calling up the landlords.
- In each of the two measurements, what is the proxy and how might it introduce (systematic/statistical) error in the measurement?
Each of them uses the proxy of self-reported time to repair. The tenants' answers may be overstated, while the landlords' answers may be understated. (Both are sources of systematic errors.) - Using the concept of triangulation, how does doing two separate measurements as described above help the Berkeley Rent Board more accurately understand how long it takes for repairs to be made?
This process helps in two ways. First, these instruments/proxies approach the repair time from different directions. This bounds the true answer as likely being between them. In addition, triangulation can also use different types of instruments/proxies (as opposed to different instances of the same type of instrument/proxy) for validation, when the errors introduced by those instruments/proxies are independent of each other.
Trustworthy thermometer
Relevant topic(s): 2.2 Systematic and Statistical Uncertainty
Consider the mercury thermometer as an instrument.
- What are you (usually) trying to measure with it?
Temperature. - What is the proxy for the quantity you're trying to measure (don't just say "the reading" or "the number I see")?
Expansion of mercury, height of mercury column. - List two techniques to validate this measure, one using interactive exploration.
Use an alcohol thermometer, Use it to measure the known temperature of boiling/ice water).
Concerned John
Relevant topic(s): 2.2 Systematic and Statistical Uncertainty
Concerned about drowsy students in plenary, John is conducting a survey to find out how much LS 22 students slept last night. He collects data by sending out a (required) Google Form where the students self-report how much they slept last night.
- What is the proxy John is using for measuring the average sleep duration of LS 22 students last night?
A Google Form where the students self-report how much they slept last night. In 2023, 92% of students got this right. - What is a source of (systematic/statistical) error introduced as a result of choosing this particular proxy? (You do not need to state whether it is systematic or statistical.)
Many possibilities. Students rounding their values to the nearest half hour (statistical), students intentionally understating their answers for sleep deprivation street cred (systematic). In 2023, 83% of students got this right. - How could John have used triangulation to validate his measurement? What is a new proxy introduced by this solution?
He could have thr students track their sleep with a monitor based on their heart rates, breadth, movement, the sounds they make, or any number of other features. In 2023, 71% of students got this right.
3.1 Probabilistic Reasoning
Honorary mentions
Relevant topic(s): 3.1 Probabilistic Reasoning
Medical journals usually have a standard of only publishing results that have a p-value less than 0.05 (i.e. probability of the same result simply due to random noise is less than 5%). Suppose a reputable journal recently published a special edition, Honorary Mentions, which includes all the articles with a p-value less than 0.10 but not quite below the 0.05 standard. As a reader, which of the following attitudes should you take about articles in Honorary Mentions?
- Only a small fraction of these papers are likely to have correct results, and it's hard to tell which ones, so I shouldn't believe them.
- Since the results are published by a reputable journal, I should believe them until another article proves them wrong.
- The scientists must not have done a good enough job to bring the p-value down to below 0.05. I shouldn't believe any of the results there.
- The results there are more likely correct than not, but there's a decent chance they're wrong, so you wouldn't want to bet your life on them.
- These are essentially the "rejected" articles, so I probably shouldn't believe them.
| In 2022, 84% of students got this right. |
| In 2023, 84% of students got this right. Several answers got expanded for clarity this year. |
Food fail
Relevant topic(s): 3.1 Probabilistic Reasoning
Below is a graph showing how the yield of four crops is projected to decrease by 2050 due to climate change projections in four different regions of the world. Each data point is based on the outcome of a particular statistical model incorporating different factors into the projections.

- For which region do the researchers tend to be most certain about the amount of yield change?
In 2023, 74% of students got this right. - Mainland Asia
- Middle East & North Africa
- Western & Central Africa
- Eastern & Southern Africa
- In Western & Central Africa, for which crop are the researchers least certain about the amount of yield change?
In 2023, 64% of students got this right. - Maize
- Rice
- Sorghum
- Wheat
- What factor are the researchers likely most certain about?
In 2023, 72% of students got this right. - Trajectory of local climate by 2050 in each of the four regions
- Yield trends based on future GMOs introduced to each region
- Yield trends based on past rates of growth for each crop
- Political stability enabling equitable food distribution in each region
3.2 Calibration of Credence Levels
Horse races
Relevant topic(s): 3.1 Probabilistic Reasoning, 3.2 Calibration of Credence Levels
Your friend, Kyle, is keen on watching horse races. Over the years, he has made a detailed record of every horse he has seen, how confident he is that they'll win the race, and how many of them actually won the race. The record is summarized in the following table.
| Confidence level | Number of horses predicted to win at this confidence level | Number of actual wins |
|---|---|---|
| 0-20% | 29 | 6 |
| 20-40% | 30 | 13 |
| 40-60% | 33 | 20 |
| 60-80% | 24 | 22 |
| 80-100% | 32 | 32 |
Is Kyle generally overconfident, underconfident, or well calibrated? Why?
| Kyle is generally underconfident.
You may want to do some quick mental maths or use a calculator for this. Among the 24 horses that Kyle is 60-80% confident will win a race, if he is truly well calibrated, then about 60-80% of those horses should actually win a race. That comes out to be between 14 and 19 horses. However, in reality, 22 of those horses won a race. This means that the confidence level he gave for those horses was too low—underconfidence. The same works for most of the other confidence levels in the given table. |
Rival pollsters
Relevant topic(s): 3.2 Calibration of Credence Levels
Two groups of pollsters regularly publish their predictions of local election results in the US, along with the credence levels associated with the predictions. Their predictions over the past 4 years are summarized as follows.
| Credence level | Number of predictions made with this credence level | Number of predictions with this credence level that came true |
|---|---|---|
| 50-60% | 29 | 16 |
| 60-70% | 30 | 19 |
| 70-80% | 33 | 26 |
| 80-90% | 24 | 20 |
| 90-100% | 32 | 31 |
| Total true predictions | 102 |
| Credence level | Number of predictions made with this credence level | Number of predictions with this credence level that came true |
|---|---|---|
| 50-60% | 29 | 23 |
| 60-70% | 32 | 26 |
| 70-80% | 25 | 25 |
| 80-90% | 22 | 21 |
| 90-100% | 36 | 35 |
| Total true predictions | 130 |
- Which firm is better calibrated?
In 2022, 70% of students got this right. In 2023, 80% of students got this right. Note that questions 1 and 2 were merged this year. - Polling Firm A
- Polling Firm B
- For the less well calibrated pollster, are they underconfident or overconfident?
In 2022, 70% of students got this right. In 2023, 80% of students got this right. Note that questions 1 and 2 were merged this year. - Underconfident
- Overconfident
- Justify your answers using the table of numbers above.
The accuracy rate (actual wins/predicted wins) falls within the claimed credence range, which means A is better calibrated than B.
Give full mark as long as they mention this comparison, even if they get the previous part wrong.In 2022, 78% of students got this right. In 2023, 80% of students got this right.
Mrs. Hewlett's math test
Relevant topic(s): 3.2 Calibration of Credence Levels
Mrs. Hewlett's class took a math test.
- Joe doesn't know how to count, so he thought he wouldn't get any questions right. He didn't bother trying, writing in "Joe" for every answer. He did not get any right.
- Allison was great at math, but not sure of herself. She thought she'd only get 85% of the problems correct, but really she got a perfect score.
- Joy reasoned that if she always chose C she would get about 20% correct. Sadly it was not a multiple choice test, so she got none correct.
- Benjamin by and large had a pretty good sense of his own abilities. He thought he would get about 80% correct, but actually only got about 75% correct.
- Who is best calibrated?
- Joe
- Allison
- Joy
- Benjamin
- Whose calibration is most underconfident?
- Joe
- Allison
- Joy
- Benjamin
Mark and Dana
Relevant topic(s): 3.2 Calibration of Credence Levels
Mark and Dana both take a 3-hour biology test. Mark feels good about the test, and is confident he will get at least 90% of the questions right. Dana feels less slightly confident about the test and thinks she will get 85% of the questions right. Mark gets 80% of the questions correct. Dana gets 70% of the questions correct.
- Who was overconfident?
- Mark
- Dana
- Both
In 2022, 94% of students got this right.
- Who was better calibrated?
- Mark
- Dana
- They were calibrated the same.
In 2022, 94% of students got this right.
Classmate calibration capabilities
Relevant topic(s): 3.2 Calibration of Credence Levels
Inspired by your favorite class, you decide to collect data about how well calibrated people are. You ask 100 students to make predictions about the coming week at various confidence levels and then report back seven days later to see if they came true. The following table shows the results of your research.
| Confidence Level | Number Predictions | Number Came True | Percent Came True |
|---|---|---|---|
| 95% ≤ C ≤ 100% | 28 | 27 | 96.45% |
| 70% ≤ C < 95% | 34 | 22 | 64.70% |
| 30% ≤ C < 70% | 91 | 20 | 21.97% |
| 5% ≤ C < 30% | 64 | 3 | 4.69% |
| 0% ≤ C < 5% | 18 | 1 | 5.56% |
C is the confidence level of the relevant predictions.
- In which confidence level bin were students the best calibrated?
In 2023, 97% of students got this right. - 95% ≤ C ≤ 100%
- 70% ≤ C < 95%
- 30% ≤ C < 70%
- 5% ≤ C < 30%
- 0% ≤ C < 5%
- In general, were students' predictions more overconfident, underconfident, or accurately calibrated?
In 2023, 65% of students got this right. - Underconfident
- Overconfident
- Accurately calibrated
- Too little information to determine
Rain or pain
Relevant topic(s): 3.2 Calibration of Credence Levels

Recall this graph from the labscussion section on calibration of credence levels. What allows weather forecasters to be better calibrated in their forecasts than doctors in their diagnoses?
| Full Credit: Weather forecasters are able to incorporate repeated feedback from the actual weather (what % of predictions actually came true) to constantly re-evaluate the credence level of their predictions, while doctors do not typically have or incorporate this level of feedback. Partial Credit: Includes reasons weather forecasters are better calibrated, but doesn't mention repeated feedback. |
| In 2023, 61% of students got this right. |
4.1 Signal and Noise
Beep beep it's a car
Relevant topic(s): 4.1 Signal and Noise
- A physics professor told you that sounds emitted from cars moving towards you sound higher pitched, and sounds emitted from cars moving away sound lower pitched. You go with a friend to the sidewalk of a busy road (speed limit 25 mph) to test if this is true by observing passing cars.
- The loud background hum from all the car tyres on the road (Signal/Noise/Neither)
- An ambulance rushing by you with its siren on (Signal/Noise/Neither)
- A car loudly blasting a pop song that you recognize as it rushes by you (Signal/Noise/Neither)
- The speed limit (Signal/Noise/Neither)
- Quiet and pleasant birdsong on a tree behind you (Signal/Noise/Neither)
- Your friend says she can barely make out the difference, but you can't. How would you improve this test by making the signal more clear?
Repeat the experiment on a highway, where the speed limit is higher. The degree of change in pitch is dependent on the speed of the cars. You could see this on a spectrogram (for example). - Suggest one way to greatly reduce the sources of noise in this test.
Repeat the experiment on a less busy road.
Self-driving car
Relevant topic(s): 4.1 Signal and Noise
- In a newly developed self-driving car, the onboard artificial intelligence (AI) uses several cameras mounted on various parts of the car (and no other instruments) to view the surroundings and make decisions. To this AI driving system, is each of the following a signal, a source of noise, or neither?
- The constant static sound from the car radio (Signal/Noise/Neither)
- The dust buildup on the camera lens (Signal/Noise/Neither)
- A pedestrian about to cross the road (Signal/Noise/Neither)
- Reflections of the street lamps' light on a wet road (Signal/Noise/Neither)
- A stop sign (Signal/Noise/Neither)
- It is well known that driving on a rainy night is very dangerous. In the language of signal-to-noise ratio, why is driving on a rainy night more dangerous than on a sunny day?
The signal-to-noise ratio is very low, because it is darker at night (low signal), and there are many sources of noise from the rain. In contrast, a sunny day has high signal and low noise. Make sure the explanation of the signal or the noise actually makes sense, not "slippery road making you skid is the noise".
Signal-to-noise ratio
Relevant topic(s): 4.1 Signal and Noise
Which of the following statements about signal-to-noise ratios (SNRs) is/are correct?
- Detecting if there is an elephant in my living room has a low SNR, because there is no elephant in my living room.
- There is a higher SNR for detecting an elephant in my living room compared to detecting an elephant in my neighbor's living room through a pair of binoculars.
- For observing the surface of the moon, the SNR is higher at night than in the daytime because the signal is stronger at night.
- For a predator, a camouflaged animal has a lower SNR because there is higher noise in its surroundings.
This particular answer is debatable. It should probably be excluded from any quizzes the students actually have to take. - Your roommate is talking loudly on the phone while you are studying, and your mind keeps being drawn towards their conversation. You play loud music to drown out their voice. This lowers the SNR.
| In 2022, 3% of students got this right. This was due, in part, to the problem not being set up to allow partial credit. |
Lecture hall
Relevant topic(s): 4.1 Signal and Noise
You are sitting near the back of a very large lecture hall, attempting to hear the Professor's story about a time he was on a runaway trolley. Unfortunately, people around you are side-talking, and you struggle to hear the professor's quiet voice across the massive lecture hall. In order to better understand the professor's story, you move closer to the professor, and away from the side-talkers. Considering the Professor's story as a signal, you have just:
- Changed neither the signal nor noise
- Increased the signal but kept the noise the same
- Decreased the noise but kept the signal the same
- Decreased the signal but kept the noise the same
- Increased the noise but kept the signal the same
- Both increased signal and decreased noise
| In 2022, 83% of students got this right. |
| In 2022, 72% of students got this right. The answers were expanded for clarity this year. |
Look! Look at thee... uh... signal-to-noise ratio!
Relevant topic(s): 4.1 Signal and Noise
Recall the childhood disfluency experiment from the Grill the Guest lesson. Which aspects of the experimental design directly impacts the signal-to-noise ratio?
- The radius around the object on the eye-tracking monitor within which the child's gaze would be considered to be directed at the object.
In 2023, 81% of students got this right. - This directly impacts the signal-to-noise ratio.
- This does not directly impact the signal-to-noise ratio.
- Having the child sit in their parent's lap.
In 2023, 71% of students got this right. - This directly impacts the signal-to-noise ratio.
- This does not directly impact the signal-to-noise ratio.
- That each pair of objects shown together (one novel, one familiar) were matched to be similar in color/shape and in how learnable their labels were.
In 2023, 67% of students got this right. - This directly impacts the signal-to-noise ratio.
- This does not directly impact the signal-to-noise ratio.
- The use of "look..." before the third presentation of the object in the fluent and disfluent audio.
In 2023, 23% of students got this right. - This directly impacts the signal-to-noise ratio.
- This does not directly impact the signal-to-noise ratio.
- The headphones the parents wore to mask auditory stimuli.
In 2023, 55% of students got this right. - This directly impacts the signal-to-noise ratio.
- This does not directly impact the signal-to-noise ratio.
- The length of the "window of analysis." (The period of time for which the researchers analyzed whether or not the toddler was looking at the novel object.)
In 2023, 57% of students got this right. - This directly impacts the signal-to-noise ratio.
- This does not directly impact the signal-to-noise ratio.
4.2 Finding Patterns in Random Noise
Combinatorial drug discovery
Relevant topic(s): 4.2 Finding Patterns in Random Noise
Combinatorial drug discovery is a process in which a large amount of different molecules are synthesized in parallel, in hopes that one of them may have the intended therapeutic effect. Suppose you are a biochemist who is looking for a molecule that can bind to a particular cell receptor (receptor A). After simultaneously synthesising and analyzing 100 different molecules, you found that three of those molecules stood out. Each of the three seems to bind to receptor A, with a p-value of less than 0.01. Which of the following is/are valid scientific approaches? (Choose all that apply.)
- The three molecules are probably spurious signals due to random fluke. Such an experimental method is fundamentally flawed, and no useful information can be gained.
- The experimental method is not flawed, but more data on the effectiveness of the three molecules should be collected in a follow-up study.
- Publish a paper about the discovery of three new effective molecules. There is no reason to mention any of the ineffective molecules.
- Publish a paper about the potential effectiveness of three new molecules. Include the list of all other ineffective molecules.
Oily acne
Relevant topic(s): 4.2 Finding Patterns in Random Noise
(Fictional) A team of scientists conducts a randomized controlled trial to investigate the hypothesis that eating more oily food causes acne. To do this, they recruited a large number of participants and randomly divided them into at least 10 groups, who are all given specific dietary regimens over two weeks. One group is the control group and receives meals with no added oil, while each of the other groups is given meals with a different type of added oil—olive oil, peanut oil, fish oil, sunflower seed oil, and so on. The meals each group receives differ only in the amount or type of oil added. Some of the results after two weeks are tabulated as follows.
| Type of oil | Average acne count relative to control group | p-value* |
|---|---|---|
| Olive Oil | -0.29 | 0.81 |
| Peanut Oil | +0.71 | 0.24 |
| Fish Oil | +1.65 | 0.049 |
| Sunflower Seed Oil | +0.48 | 0.39 |
| ⋮ | ⋮ | ⋮ |
| All above groups combined | +1.47 | 0.071 |
*The p-value is the probability that chance alone would produce an "average acne count relative to control group" equal to or higher than the measured value for that single type of oil.
The team of scientists wishes to publish in a journal that only accepts studies with a p-value lower than 0.05. Which of the following should be done by scientists following good scientific practice? Select all that apply.
- The conclusion "oily foods cause acne" should not be published, as its p-value of 0.071 is higher than 0.05.
In 2023, 87% of students got this right. - The conclusion "foods cooked with fish oil cause acne" should be published on its own, as its p-value of 0.049 is less than 0.05.
In 2023, 71% of students got this right. - The scientists should investigate several more types of oil to see if the overall p-value can be brought from 0.071 to below 0.05.
In 2023, 65% of students got this right. - The scientists should conduct a new experiment with new participants on the hypothesis "foods cooked with fish oil cause acne".
In 2023, 78% of students got this right. - Instead of dividing the data into individual types of oil, the scientists should group the data into "vegetable oils" and "animal oils" to see if one category produces more acne at a p-value of less than 0.05, so that the result may be published.
In 2023, 73% of students got this right.
| In 2022, 35% of students got this right. |
Happy babies
Relevant topic(s): 4.2 Finding Patterns in Random Noise
Nancy wants to find out what wall paint colors result in happier babies at a nursery, so she conducts a study using 20 different colors of paint randomly assigned to 1000 nurseries across the country. For 19 colors, she finds no significant increase in happiness, but for purple she discovers a statistically significant increase in happiness (p < 0.05). She infers that there is only a 5% chance this result is due to chance, and publishes a paper declaring that parents who want happier babies should paint their nurseries purple.
This is an example of...
- Confirmation Bias
- The Look Elsewhere Effect/p-hacking
- The Availability Heuristic
- Pathological Science
| In 2022, 90% of students got this right. |
Bartholomeus' study
Relevant topic(s): 4.2 Finding Patterns in Random Noise
Bartholomeus is a researcher who is interested in studying the effects of listening to white noise. He asks a random sample of 100 people to listen to white noise for ten minutes and then fill out a questionnaire that measures 20 different psychological variables. Bartholomeus finds a statistically significant effect of white noise on appetite, and publishes the result without mentioning any of the other variables where he found no effect.
- What course concept might make us skeptical about these results?
In 2023, 58% of students got this right. - The Look Elsewhere Effect
- The File Drawer Effect
- The Hot Hand Fallacy
- In 2-3 sentences, what is a way that Bartholomeus could correct for this?
Student should mention either that he collects more data and keeps getting results that agree with this or that he uses a more strict criteria for statistical significance. In 2023, 74% of students got this right.
What are the odds?
Relevant topic(s): 4.2 Finding Patterns in Random Noise


Gabriel purchased 262,144 six-sided dice (first picture), rolled them all, and then arranged them in a 512-by-512 square. He noticed that there is a pattern somewhere within this square (second picture). (The full square of dice is not pictured here.) He exclaims:
- "Wow! Six 1's in a row, next to four 5's in a column, next to four 6's in a row. What are the odds!? The dice I bought must not be totally random."
Explain the flaw in Gabriel's reasoning.
| Even in total randomness, patterns are expected to show up. In a giant square of randomly thrown dice, we should not expect numbers to be all evenly spread out, but they should occasionally be arranged in long streaks. |
We're not in KanZAPS anymore!
Relevant topic(s): 4.2 Finding Patterns in Random Noise
Refer to the following two (hypothetical) maps of lightning strikes in Kansas within the last 5 days.


- Which of the maps shows that each lightning strike's location in the state is totally random? Briefly explain how you determined this.
Map 1 is totally random because the locations are not neatly separated from each other, but are sometimes clumped up. In 2023, 77% of students got this right. - Why might someone be inclined to falsely think it is the other map that is totally random?
Map 1 contains clumps and voids, which appear as "patterns." One may mistakenly think that randomness never produces patterns such as these. In 2023, 85% of students got this right.
5.1 False Positives and Negatives
Fingerprint sensor
Relevant topic(s): 5.1 False Positives and Negatives
Some smartphones use a fingerprint sensor to authenticate the user. In the language of false positives and false negatives, explain why the sensor on your own phone may so often reject your own fingerprint.
| False Positive: successfully authenticating someone that isn't you. Consequence: your data stolen.
False Negative: not recognizing your fingerprint. Consequence: time wasted, inconvenience. Weighing the two consequences, one would rather be slightly inconvenienced than to have their data stolen. This is why the fingerprint sensor is very strict—it minimizes false positive rates at the cost of increasing false negatives. |
Crush
Relevant topic(s): 5.1 False Positives and Negatives
Lynn has a crush on her friend Harriet, and she suspects but doesn't know if Harriet returns her interest. If a false positive is Lynn thinking Harriet likes her when she doesn't…
- What's a false negative in this situation, and what are the costs of a false negative?
False Negative: Lynn thinks Harriet doesn't like her when she actually does.
Cost: Miss out on a great relationship they could have. They remain regular friends. - What are the costs of a false positive in this situation?
False Positive: Lynn thinks Harriet likes her back, but she actually just sees her as a friend.
Cost: The friendship becomes awkward, or nothing bad would happen, and they remain good friends.
Officer Barbrady
Relevant topic(s): 5.1 False Positives and Negatives
Officer Barbrady, who polices a small Colorado town, is proud of his record that "every person arrested under his watch has later been convicted of a crime by the court". (Assume for the sake of this problem that every person convicted by the court is truly guilty of a crime.)
- In the context of arrests, what is a false positive and a false negative?
False Positive: Person arrested is in fact innocent.
False Negative: Guilty person not arrested.In 2022, 93% of students got this right. - What value judgment did Officer Barbrady make in the trade-off between false positives and false negatives?
He probably finds it more important to make sure no innocent person is wrongly arrested and inconvenienced/traumatized than to make sure no criminal runs free.
Answer has to clearly show a comparison/trade-off, not just descriptions of the costs.
Some people may accidentally switch positive/negative but it's clear they understand the underlying moral judgment. Give them the point.In 2022, 61% of students got this right.
🐦 ∨ ✈
Relevant topic(s): 5.1 False Positives and Negatives
Imagine a radar operator who needs to determine whether a blip on the radar is an airplane (signal) or something else like a flock of birds (noise). Currently, the threshold for calling a blip a plane is set at a signal strength of 0.325.

If that threshold is moved to the right to 0.4, that means that...
- The operator will be more conservative (with the "plane" alarm) and the probability of a false positive will be higher.
- The operator will be less conservative and the probability of a false positive will be higher.
- The operator will be less conservative and the probability of a false negative will be higher.
- The operator will be more conservative and the probability of a false negative will be higher.
| In 2022, 74% of students got this right. |
Luisa's Mammogram
Relevant topic(s): 5.1 False Positives and Negatives
- A mammogram is a medical test used to detect breast cancer. It is a routine test recommended for women over a certain age. Luisa goes for her annual mammogram. The results come back positive for breast cancer. Which of the following is an example of a false positive in this scenario?
In 2023, 97% of students got this right. - Luisa has breast cancer and the mammogram detected it accurately.
- Luisa does not have breast cancer but the mammogram detected an abnormality.
- The mammogram detected breast cancer accurately but it was at a very early stage that went away on its own.
- The mammogram detected breast cancer accurately but Luisa underwent treatment that eliminated the cancer before it could progress.
- Impressed at the power of analyzing decisions in terms of positives and negatives, Luisa tries to apply it in other aspects of her life. Which of the following scenarios can this analysis best be applied?
In 2023, 60% of students got this right. - Whether or not Luisa should decide to follow her dream and become a world champion in synchronized crochet.
- Whether or not Luisa's age is the cause of onset for her arthritis.
- Whether or not getting a good night's sleep improves Luisa's synchronized crocheting scores.
5.2 Scientific Optimism
Long standing computer science problem
Relevant topic(s): 5.2 Scientific Optimism
Alix is an accomplished computer scientist who is trying to tackle a longstanding unsolved problem. The last time somebody made significant progress on the problem was in 1988. She recently learned of a new technique that can potentially open up a new path to solving this problem. However, after working on it for 2 months, she is getting a little stuck. Which of the following attitudes is most consistent with the spirit of scientific optimism, as explained by Prof. Perlmutter?
- If all the best minds in computer science weren't able to solve the problem in 33 years, what are the chances that I would be the one to make the next big stride?
- The problem is probably a very difficult one, but if I just put my mind to it for a little while longer, perhaps I will make a breakthrough.
- Science is ever changing, and I'm confident that some other brilliant mind will come along to solve the problem.
- I am the most accomplished scientist among my colleagues, and I am most qualified to study this problem.
- I can solve the problem in no time, if only I happen to stumble upon the right approach.
Find the optimism
Relevant topic(s): 5.2 Scientific Optimism
Which of the following scenarios exhibit(s) the attitude of "scientific optimism" as described in this course? Select all that apply.
- Congress has tasked NASA with cataloguing and calculating the precise orbits and interactions of all bodies (planets, moons, asteroids, and comets) in the Solar System so as to predict devastating collisions of these bodies with Earth. NASA reports to Congress the good news that according to current trends in technology (e.g. Moore's Law), a supercomputer capable of such a task will be available for purchase in approximately 12 years.
- UC Berkeley has decided to embark on the construction of new high-density dormitories with 8-by-10-foot rooms that have two triple-decker bunk beds, estimating that by the time the plans reach the desks of the City Planning Department for approval, virologists will have worked out a permanent solution to the Covid-19 pandemic.
- On the current trajectory, there will not be financially viable fusion reactors for at least 300 years. Motivated by the recent discovery of a high magnetic field material, a group of scientists have decided to dedicate a decade of their time to solving this problem.
- Martin and Stanley found small hints that the device they built was able to produce nuclear fusion, at such a low temperature and pressure that it would overturn the conventional understanding of nuclear fusion. Facing skepticism from colleagues, none of whom were able to reproduce their results, the duo continued to defend the device and promote it as the "future of energy".
- People have been trying to cure the common cold for thousands of years, and no one has found a complete solution. Carrie, a biologist, sees a new route through CRISPR gene editing that could potentially shorten the average duration of a cold by one day. Even shortening the average duration by one day would be huge, she thinks, and if she can shorten it by one day, why not two? If two… She decides to give it a try.
What is scientific optimism
Relevant topic(s): 5.2 Scientific Optimism
Scientific optimism, as discussed by Professor Saul Perlmutter, is best described as:
- The attitude that you are the best person to solve the problem at hand.
- The attitude that the problem at hand could be solved quickly, if you only hit upon the right approach.
- The belief that scientists have answers to the most important questions.
- The belief that science is the best approach to solving all problems.
- The attitude that you can make progress on a problem at hand, if you persist for long enough.
- The hope that eventually the scientific community will collectively come up with solutions to the world's difficult problems.
| In 2022, 85% of students got this right. |
Find the optimismn't
Relevant topic(s): 5.2 Scientific Optimism
For each of the following, select whether or not it is an example of scientific optimism.
- Mathematicians continuously building on each other's work to prove Fermat's Last Theorem for three centuries following the original conjecture by Fermat in 1637.
In 2023, 91% of students got this right. - Scientific Optimism
- Not Scientific Optimism
- An architect crafting an innovative design for a sustainable building continues to work on her project by persuading herself that she is making incremental progress.
In 2023, 83% of students got this right. - Scientific Optimism
- Not Scientific Optimism
- A social scientist believing that her finding will have a significant impact on public policy.
In 2023, 84% of students got this right. - Scientific Optimism
- Not Scientific Optimism
- A politician promising their constituents that a cure for cancer will be found within the next year.
In 2023, 94% of students got this right. - Scientific Optimism
- Not Scientific Optimism
- A Berkeley PhD candidate continuing to research a promising application of CRISPR for treating cystic fibrosis despite her faculty advisor believing that nothing will come out of it.
In 2023, 94% of students got this right. - Scientific Optimism
- Not Scientific Optimism
- A solid state physicist growing the same material over and over again in the same way and testing to see if it's a room temperature superconductor.
In 2023, 72% of students got this right. - Scientific Optimism
- Not Scientific Optimism
Best example of scientific optimism
Relevant topic(s): 5.2 Scientific Optimism
Choose the example from the list below that best exemplifies the spirit of scientific optimism.
- A researcher spent 10 years looking for the cure to a rare blood disorder. Despite making a fair amount of progress, the scientist decided there is no cure. They turned to a new topic.
- A marine biologist has been working for many years to invent a chemical to neutralize the impacts of oil spills on marine wildlife. She tried many chemicals that did not help, and found one that helps a little bit. After a few more years, she found a variation that helps a little more. She's still trying to find something even better.
- A group of taxi-drivers has been inspired by new engineering work to create flying cars. The problem of making flying cars seems hard, but they have faith that the scientists will figure it out.
- A researcher attempted to make a new positive-reinforcement dog collar for training that makes the dog feel wonderful when it behaves well. He persists for a year, then sells his unfinished research for a million dollars.
| In 2022, 97% of students got this right. |
Sum questions
Relevant topic(s): 5.2 Scientific Optimism
For each of the following situations, say whether it is (a.) positive-sum, (b.) zero-sum, or (c.) negative-sum.
- In order to keep conducting research, labs compete for a limited amount of grant funding each year. (From the perspective of the labs competing.)
- Positive-sum
- Zero-sum
- Negative-sum
- A group of hunter-gatherers goes on hunting and gathering expeditions in different subsets of people. Sometimes one subgroup comes back with food, sometimes other subgroups come back with food. Every time, the food is shared among everyone. (From the perspective of the hunter-gatherers.)
- Positive-sum
- Zero-sum
- Negative-sum
- There are two countries who both want a piece of land at the border between them. They fight over this piece of land by ordering people who would otherwise be farming, making tools, and constructing buildings to go and fight each other instead, leading to much injury and death. (From the perspective of the farmers/soldiers who live in both countries.)
- Positive-sum
- Zero-sum
- Negative-sum
- There are two countries who both want a piece of land at the border between them. They fight over this piece of land by ordering people who would otherwise be farming, making tools, and constructing buildings to go and fight each other instead, leading to much injury and death. (From the perspective of the arms dealers in both countries.)
- Positive-sum
- Zero-sum
- Negative-sum
- Several labs are competing to solve a problem. They approach it from different perspectives using different methods, and make different breakthroughs which they publish as they emerge. One lab makes the key discovery building on discoveries made by other labs. (From the perspective of the scientific community as a whole.)
- Positive-sum
- Zero-sum
- Negative-sum
6.1 Correlation and Causation
Portable metal detector
Relevant topic(s): 6.1 Correlation and Causation
Sasha recently purchased a portable metal detector, in the hopes of finding lost jewelry at the local beach, a popular tourist destination. Curious about the beeping noises it's making, a passerby approaches her and skeptically asks, "are you sure it's actually detecting metal and not just making random beeping noises?" To convince the passerby, Sasha walks a little further. As soon as the metal detector starts beeping loudly, she digs into the sand. Lo and behold, she finds a gold ring. "See, it does work," says Sasha ecstatically to the passerby.
- In this scenario, what is the causal hypothesis Sasha is trying to test? In other words, in the statement "X causes Y", what are X and Y?
She's trying to test the statement "metal jewelry in sand causes detector to beep." - If you are the passerby, state one reason why you may still be skeptical of the device after Sasha's demonstration.
This single instance may just be a coincidence. It may have been something else in the vicinity of the gold ring that triggered the detector. The beach may be littered in metal jewelry, and she would've found something even she had dug elsewhere. - Briefly describe a randomized controlled trial that can demonstrate that the metal detector does indeed work.
Pick an area on the beach where we've made sure there's nothing buried underneath the sand. Divide the area into little patches. Randomly choose half of those patches, bury some metal jewelry in them. In the other half, either leave the patches empty or bury some non-metal objects in them. Sasha is not allowed to see or know any of this. Then, ask her to use the detector over the whole area. If the detector beeps above the patches with metal and doesn't beep above the patches without metal, then we can confirm that the beeping is caused by the metal jewelry.
Twin adoption
Relevant topic(s): 4.2 Finding Patterns in Random Noise, 6.1 Correlation and Causation
Identical twins separately adopted by different families are extremely valuable to biologists and psychologists in experiments that determine whether a physical trait or behavior is due to nature or nurture. One psychologist is trying to determine whether being raised in a high-income family (earning more than $400,000 a year) causes bipolar disorder. They study 10,000 pairs of adult identical twins that were separated at birth and adopted by families from a range of financial backgrounds.
- If causation is equivalent to "correlation under intervention", what simple observational result would demonstrate that "being raised in a high-income family causes bipolar disorder"?
Among all twins, the twin that was adopted by a high-income family having/correlated with higher rates of bipolar disorder.
The answer has to be a comparison ("more" or "higher") of rates of bipolar disorder between the high and low-income families. It's not enough to just say "the twins in high-income families have bipolar", because they haven't specified whether the twins in low-income families also have more/less bipolar disorder.
Allow answers that use singular "twin" rather than "twins." - Describe how each of the criteria for a randomized controlled trial is satisfied by such a study:
- Intervention
One twin being adopted by a wealthy family/the variable being intervened on is the income of the adoptive family.
Don't give points to people who say "the experimenters put the twins in different families." - Control condition
The other twin being adopted by a non-high-income family/The twins are exactly the same except for their adoptive families (the intervention).
Don't give points to "the twins are the same" - Random assignment
Presumably it is random which twin is adopted by which family.
Don't give points to "randomly select 10,000 pairs of twins". That's random selection of a population sample, not random assignment of the already chosen samples.
- Intervention
- From these 10,000 pairs of twins, this psychologist did not find that being raised in a high-income family causes bipolar disorder. One of the other psychologists suggested, "it is so hard for us to get 10,000 pairs of identical twins. Why don't we use the same 10,000 pairs to study whether being raised in a high-income family causes any other type of mental disorder, and then only publish the result that confirms a causation?" If you were the first psychologist, should you say this is a good idea? Why or why not?
No, this would not be a good idea. One limited set of data cannot be used to validate too many hypotheses, as one of them could turn out to be confirmed by a spurious correlation/by random chance./The more hypotheses one asks of the same data set, the less significant any of the individual results become./Only publishing the one correlation without disclosing all the other rejected hypotheses would be p-hacking.
Give partial credit to "sample is not representative of general population, so it won't confirm the stated hypothesis anyway"/"there may be other confounding variables aside from the income that may cause mental disorders."
Give only partial credit to people who just say "p-hacking" without explanation. Give full marks for reasonable explanations but no mention of "p-hacking" or "look elsewhere".
Give only partial credit to "the psychologist is picking and choosing only studies that favour them as a researcher".
Speed writing
Relevant topic(s): 6.1 Correlation and Causation
Suppose you want to find out whether writing with a red pen causes people to write faster. Which of the following would be the most effective test of this hypothesis? (Not necessarily perfect, just most effective.) Assume, for each study, that the measure of speed is how many letters (i.e. alphabet letters) they write in 5 minutes, when asked to write a description of their day.
- Randomly choose 1,000 undergraduates, give each participant a red pen and a black pen, let them choose which pen to use, and ask them to write about their day.
- Take 200 undergraduates, randomly hand out 100 red pens and 100 black pens, so that each participant has one pen, and have them write about their day with the pen they are given.
- Randomly choose two cities in different parts of the world, randomly choose 3,000 people in each of the two cities, give the participants in one city red pens and the participants in the other city black pens to write about their day.
- Pick 10,000 random people from all around the world and ask whether they tend to write with a red pen or a black pen. Then have them write for five minutes about their day.
- Find a pair of identical twins who grew up together and randomly give one twin a red pen and the other twin a black pen to write about their day.
| In 2022, 67% of students got this right. |
Orange sodas or orange orange sodas?
Relevant topic(s): 6.1 Correlation and Causation
A food scientist is trying to find out if people's perception of taste is affected by the color of the drink. Suppose there is a food dye which turns drinks orange without affecting the taste. Which of the following experimental designs will most effectively test the hypothesis that "people enjoy orange-flavored soda with an orange color more than colorless orange-flavored soda"?
- Randomly choose 400 people from the general population. Randomly assign them either an orange-colored orange-flavored soda or a colorless orange-flavored soda. Ask them to rate their enjoyment of the drink from 1 to 10.
- Randomly choose 1,000 undergraduates. Offer each participant their choice of an orange-colored orange-flavored soda or a colorless orange-flavored soda. Record their choice.
- Randomly choose 2,000 undergraduates from Princeton and 2,000 undergraduates from UC Berkeley. Give the former orange-colored orange-flavored soda and the latter colorless orange-flavored soda. Ask them to rate their enjoyment of each drink from 1 to 10.
- Randomly choose 10,000 people from the general population. Randomly assign them either an orange-colored orange-flavored soda or a colorless orange-flavored soda. Blindfold the participants so they don't know which soda they are drinking. Ask them to rate their enjoyment of the drink from 1 to 10.
- Randomly choose 10,000 people from the general population, send each a survey asking them if they preferred orange-colored orange-flavored soda or colorless orange-flavored soda.
Causation and correlation in RCTs
Relevant topic(s): 6.1 Correlation and Causation
For each of the following claims about randomized controlled trials (RCTs), say if it's true or false.
- The participants of the study must be randomly chosen from the general population. (True/False)
In 2022, 28% of students got this right. At this point in time, the question said "are randomly chosen" instead of "must be randomly chosen." - The investigators cannot know the hypothesis. (True/False)
In 2022, 95% of students got this right. - RCTs allow inferences about singular causation. (True/False)
In 2022, 80% of students got this right. - RCTs allow inferences about general causation. (True/False)
In 2022, 90% of students got this right. - You can only draw inferences about the people in the RCT study. (True/False)
In 2022, 83% of students got this right. - RCTs always have some kind of control condition. (True/False)
In 2022, 99% of students got this right. - RCTs are the only legitimate form of evidence for causation. (True/False)
- RCTs require that we are aware of every confounding variable. (True/False)
- The control and intervention groups must be the same size. (True/False)
- You can properly execute all the components of an RCT but have poor external validity. (True/False)
Randomized coffee trial
Relevant topic(s): 2.2 Systematic and Statistical Uncertainty, 2.3 Plenary, 6.1 Correlation and Causation, 7.1 Causation, Blame, and Policy
Nina, a hypothetical LS22 GSI, wants to figure out how to best stay awake and alert during plenary. Typically, she does so by drinking 2-3 cups of coffee per day. Do not judge her.
- Draw a causal network (i.e. W → X → Y → Sleepiness ← Z), using at least four different/interconnected causes. In sentences, briefly describe what the causal network you've drawn means.
Correct answers should include a causal network that includes factors that make sense to contribute to each other such as "coffee", "time spent sleeping" "noise pollution", etc. The description should also make sense. In 2023, 97% of students got this right. - Nina wants to perform an RCT to determine if coffee really increases her alertness during plenary. She decides to set up a test where participants either drink coffee or water and then watch a five minute PlayPosit. During the PlayPosit, she uses an eye-tracker to measure the participants' alertness. Which of the following would be the most effective test of Nina's hypothesis? (Not necessarily perfect, just most effective.)
In 2023, 87% of students got this right. - She randomly chooses 3,000 undergraduate students and lets them choose whether to drink coffee before the test.
- She randomly assigns her 300 LS22 students to either drink coffee or water before the test.
- She randomly selects two different universities, randomly chooses 3,000 undergraduates in each one, and then gives participants at one school coffee and the other school water before the test.
- She finds a pair of identical twins from the undergraduate population at Cal and gives one coffee and the other water before the test.
- What is the proxy Nina is using?
Eye-tracking while watching the PlayPosits. In 2023, 89% of students got this right. - What is a source of systematic error introduced as a result of choosing this proxy?
Many possible options. The PlayPosits could be less stimulating than plenaries. No matter which treatment is received, the results are biased in one way or the other (more alert or less alert). In 2023, 68% of students got this right. - What is a source of statistical error introduced as a result of choosing this proxy?
Many possible options. Eye-tracking may introduce additional noise. In 2023, 87% of students got this right. - What is a possible confounding factor that would not be eliminated as a result of this study that affects its external validity with regards to Nina's intended application?
Several possibilities. For instance, all the proposed studies involve undergraduate students. Nina is a grad student and may therefore be systematically different in all cases. In 2023, 91% of students got this right. - In the language of singular and general causation, why else might Nina have difficulty applying this study to her life?
Drinking coffee may have a general cause of increasing alertness. But, Nina is a singular individual/special snowflake. She may be so on top of life and get so much sleep that coffee doesn't make her more alert. Instead, it makes her jittery and causes her to pay worse attention. In 2023, 47% of students got this right.
6.2 Hill's Criteria
Limb deformities
Relevant topic(s): 6.2 Hill's Criteria
In 1961, doctors in West Germany started noticing an increase in severe limb deformities in newborn infants. The drug Contergan, which had been introduced to the global market a few years prior, was blamed as the culprit. Suppose you were the West German authorities and needed to make a decision on whether the drug should be banned.
- To properly determine whether Contergan causes birth defects, a randomized controlled trial should be performed. Why would such a trial be impossible or impractical?
Administering a drug that can potentially cause severe birth defects in infants is highly unethical, even if the scientific data may end up saving lives. This is also a matter of immediate urgency, giving no time for a proper trial. - For each of the Hill's criteria below, write down the corresponding questions you would need to answer in order to gather evidence for the claim that "Contergan causes birth defects".
- Dose-response curve (a.k.a. Biological gradient)
Do we observe higher rates of limb deformities in infants among mothers that took a higher dose of Contergan? - Plausible Mechanism
Is there a chemical/biological explanation for the interference of the drug with the development of the fetus? - Specificity
Are these limb deformities seen exclusively in infants whose mothers took Contergan? - Consistency across different contexts
Has the correlation between taking Contergan and infant limb deformities been observed in other countries outside of West Germany? - Temporality (Temporal Sequence of Cause and Effect)
Did the mothers take Contergan before the fetus developed deformed limbs?
- Dose-response curve (a.k.a. Biological gradient)
NFL concussions
Relevant topic(s): 6.2 Hill's Criteria
Suppose you find out that former National Football League (NFL) players who had more concussions are more likely to have chronic traumatic encephalopathy (CTE), which is a form of long-term brain damage causing various cognitive and behavioral problems. One candidate hypothesis is that concussions cause CTE.
- Why would a randomized controlled trial be difficult or impossible to perform?
In 2022, 92% of students got this right. - Choose two forms of evidence listed below, and say what question you would need to answer to gather each form of evidence (in trying to find out whether concussions cause CTE). We have given you the first answer to the first criterion as an example. Answer two of the following:
In 2022, 70% of students got this right. - Example: Dose-response curve (a.k.a. Biological gradient)
- Does a higher frequency of playing football correlate with higher rates of CTE?
- Plausible Mechanism
Is there a physiological mechanism that links concussions to long-term changes in the brain? - Specificity
Does CTE only occur in those with high frequencies of concussions and not in regular people? - Consistency Across Different Contexts
Are higher rates of CTE also observed in other professions with higher frequencies of concussions, such as in boxers or military soldiers? - Temporality (temporal sequence of cause and effect)
Do the symptoms of CTE set in only after an accumulation of concussions?
- Example: Dose-response curve (a.k.a. Biological gradient)
- What is an alternative hypotheses for the correlation between concussions and CTE in former NFL players?
Repeatedly body slamming or getting slammed by other players also causes damage elsewhere in the body, which later manifests as CTE.
Players who repeatedly get concussions also have a behavioral pattern that makes them more likely to get CTE through non-concussion causal pathways.In 2022, 78% of students got this right.
Johnson & Johnson
Relevant topic(s): 6.2 Hill's Criteria
Johnson & Johnson is currently facing 35,000+ lawsuits accusing the company of producing baby powder that is contaminated with asbestos. The lawsuits allege that this has caused ovarian cancer and other diseases for many women who have used the product. While it would be considered unethical to knowingly give this baby powder to women and study their symptoms down the road, we can apply Hill's criteria to better understand the relationship here.
Imagine you are a lawyer who is suing Johnson & Johnson for their baby powder. Name two criteria from Hill's criteria that you might bring up. For each, describe a type of evidence that might have supported this hypothesis. Even if you don't have the evidence right now, you can posit what specific information you would need in order to fulfill the criteria.
| Students must provide two of Hill's criteria and relevant descriptions of data needed to support the hypothesis. |
| In 2022, 92% of students got this right. |
Sandworms!
Relevant topic(s): 6.2 Hill's Criteria
You live on a mysterious, dry desert planet named Arrakis. One of the few organisms capable of surviving on this planet are massive sandworms, which are, on average, 0.5 kilometers long and 15 meters tall. You've noticed recently that a lot of worms are becoming sick and dying. You think it has something to do with a volcanic sand bed that surfaced after a big windstorm. You do some research by tracking where different worms crawl and which worms get sick. You compile your results and conclude that the volcanic sand is causing worm illness by using Hill's criteria for causation.

Match the Hill's criteria to the type of evidence that you use to support your conclusion.
- Only worms that crawl through the volcanic sand bed get sick.
In 2023, 78% of students got this right. - Prior Plausibility
- Temporality
- Specificity
- Dose-response Curve
- Consistency
- Different worm species, sizes, and ages all become ill after crawling through the volcanic sand.
In 2023, 92% of students got this right. - Prior Plausibility
- Temporality
- Specificity
- Dose-response Curve
- Consistency
- You know that this type of volcanic sand has high amounts of rare earth elements and radioisotopes that can kill and damage cells and organs.
In 2023, 83% of students got this right. - Prior Plausibility
- Temporality
- Specificity
- Dose-response Curve
- Consistency
- Worms that live closer to the sand beds and spend more time crawling through the volcanic sand display greater illness severity.
In 2023, 86% of students got this right. - Prior Plausibility
- Temporality
- Specificity
- Dose-response Curve
- Consistency
- You only started observing worm illness after the windstorm uncovered the volcanic sand bed.
In 2023, 86% of students got this right. - Prior Plausibility
- Temporality
- Specificity
- Dose-response Curve
- Consistency
7.1 Causation, Blame, and Policy
NBA referees
Relevant topic(s): 7.1 Causation, Blame, and Policy
Like most people, NBA referees do not like to be vilified for their judgment calls. This affects their calls in some games. Which of the following patterns would you expect them to follow to avoid angering the fans?
- Referees call more fouls near the end of close games (as compared to average # of fouls called across all basketball games)
- Referees call fewer fouls near the end of close games
- Referees call more fouls near the beginning of close games
- Referees call fewer fouls near the beginning of close games
| The answer is the first one because omission bias will cause the fans to interpret mistakes of commission (calling a foul when they shouldn't have) to be more serious than ones of omission (not calling a foul when they should have). |
Singular and general causation
Relevant topic(s): 7.1 Causation, Blame, and Policy
From the following statements, select the one(s) that is/are about general causation.
- The El Dorado wildfire in 2020 was caused by a smoke bomb at a gender reveal party.
In 2023, 93% of students got this right. - Ariel's back injury was caused by lifting heavy weights with bad posture at the gym earlier today.
In 2023, 92% of students got this right. - Inhalation of radon from radioactive minerals underground is the second leading cause of lung cancer.
IN 2023, 95% of students got this right. - A reduction in gun violence can be achieved by requiring gun owners to first take and pass a safety and competency test.
In 2023, 92% of students got this right. - Chantelle's award of a special exploratory grant enabled her discovery of a new molecule.
In 2023, 88% of students got this right.
Non-free money
Relevant topic(s): 7.1 Causation, Blame, and Policy
You were recently elected President of the United States amidst an economic crisis and you are trying to keep approval ratings from dropping as much as possible and realize that, no matter what, you're going to cost people money. Which of the following should you choose to maximize the chance that you keep your approval ratings as high as possible? Why?
- You should let the economic crisis die out naturally. In the process, each citizen will face an average economic burden of about $3,000. You do this because it's an act of commission.
- You should let the economic crisis die out naturally. In the process, each citizen will face an average economic burden of about $3,000. You do this because it's an act of omission.
- You should implement a new tax plan that will cost each citizen $3,000, but will help regulate the economy. You do this because it's an act of commission.
- You should implement a new tax plan that will cost each citizen $3,000, but will help regulate the economy. You do this because it's an act of omission.
| In 2022, 75% of students got this right. |
Most likely causation
Relevant topic(s): 7.1 Causation, Blame, and Policy
For each of the following, is it most likely a case of singular or general causation?
- Smoking causes lung cancer (Singular/General)
In 2022, 95% of students got this right. - Ash scratched Bill, causing Bill to bleed (Singular/General)
In 2022, 100% of students got this right. - Loud noises stress out children (Singular/General)
In 2022, 98% of students got this right. - Helmets reduce injury rates of bikers (Singular/General)
In 2022, 94% of students got this right.
It (might be) in the water
Relevant topic(s): 7.1 Causation, Blame, and Policy
A February 2022 meta-analysis in the journal Frontiers of Public Health proposed supplementing drinking water with lithium as a public health measure for suicide prevention. It assessed several studies that showed a correlation by comparing areas with different water supplies. Areas with lithium naturally present in low amounts in the drinking water had lower overall suicide rates (SR). Many studies analyzed also showed no effect. The authors of the analysis also reviewed literature demonstrating no/few adverse side effects to exposure to low doses of lithium in healthy patients.
- Identify whether each of the following statements about causation is true or false.
- These studies assessed whether lithium causes a reduction in SR via randomized controlled trials.
In 2023, 94% of students got this right. - True
- False
- The journal's proposal is due to low lithium intake being a possible general cause affecting a population's SR.
In 2023, 22% of students got this right. - True
- False
- A singular cause of SR may be irrelevant to blood lithium levels in an individual.
In 2023, 92% of students got this right. - True
- False
- These studies identify whether the presence (or lack thereof) of lithium in the water supply caused an individual to commit suicide.
In 2023, 90% of students got this right. - True
- False
- These studies assessed whether lithium causes a reduction in SR via randomized controlled trials.
- Why might the possibility of someone having an adverse reaction to lithium in the water cause a policymaker to be wary of implementing the journal's proposal despite the apparent benefits in terms of overall lives saved? Please explain in 2-3 sentences, using at least one course concept related to biases in your answer.
Answer should explain this in terms of omission bias/sins of commission. Just listing the name of the bias is insufficient for full credit. In 2023, 39% of students got this right. Note that the question was graded particularly harshly this year.
Alaskan oil spill
Relevant topic(s): 7.1 Causation, Blame, and Policy
In 1989, a tanker ship called the Exxon Valdez experienced a critical failure and released 11 million gallons (17 olympic sized swimming pools) of crude oil onto the Prince William Sound off the coast of Alaska. It was known by the company that they would be unable to properly clean a medium to large oil spill in this region.
Captain Hazelwood, in charge of navigating the Exxon Valdez, was later found to have a significant blood alcohol content shortly after the spill. However, at the time of the accident, Captain Hazelwood had left his Helmsman, Mr. Claar, in charge of steering around an iceberg. The ship's iceberg monitoring system had been broken for over a year, despite appeals from the crew to management at Exxon, who had also failed to update their equipment to industry standards. Mr. Claar had worked a very long shift, and at 12:03 am, steered into a coral reef instead.
- For each of the following statements, select whether it is true or false.
- Mr. Claar steering into a reef was a singular cause of the spill. This was an act of commission. (True/False)
In 2023, 64% of students got this right. - Mr. Claar steering around an iceberg was a general cause of the spill. This was an act of commission. (True/False)
In 2023, 73% of students got this right. - Captain Hazelwood's intoxication during his shift was an act of omission. (True/False)
In 2023, 93% of students got this right. - Captain Hazelwood failing to supervise Mr. Claar was an act of omission. (True/False)
In 2023, 81% of students got this right.
- Mr. Claar steering into a reef was a singular cause of the spill. This was an act of commission. (True/False)
- Worried about the reputation of the company, an Exxon executive decides to fire Mr. Claar. What's an alternative policy that would be more likely to reduce accidents like this in the future? In the context of singular/general causation, why might this be a better response?
- Answer includes a policy that addresses a general cause of accidents such as:
- Oil industry standards allowing crew to work long shifts contributes to accidents as a general cause of oil spills. We could intervene with tougher labor policies to limit shift length.
- Stop oil drilling/shipping near fragile ecosystems
- Institute testing for intoxication of crew aboard shipping vessels
- Institute climate change to increase the global temperature and melt all icebergs
- Answer explains the policy in terms of singular/general causation.
- Must include something to the effect of "general causes are likely to persist and cause future incidents, whereas addressing a singular cause will only prevent the unlikely event of that person/cause from acting again to make the same mistake. So intervening with general causes are more likely to prevent more accidents."
In 2023, 81% of students got this right. - Answer includes a policy that addresses a general cause of accidents such as:
7.2 Emergent Phenomena
Example phenomena
Relevant topic(s): 7.2 Emergent Phenomena
Give one example of an emergent phenomenon, and explain briefly why it is emergent. Be sure to include (1) the smaller entities and (2) at least one rule followed by the smaller entities which in aggregate leads to a larger and more complex pattern.
| In 2022, 92% of students got this right. |
Described phenomena
Relevant topic(s): 7.2 Emergent Phenomena
Describe how you can obtain an emergent phenomena from local rules.
Phantom Traffic Jam
Relevant topic(s): 7.2 Emergent Phenomena

The video above demonstrates the formation of a traffic jam.
You may have experienced this. You're on the highway, when the traffic in front of you slows to a crawl. You think, "there must be a traffic accident ahead." However, after several minutes in a slow traffic jam, the speed picks up again, and no accident can be seen in this area. It seems that the traffic jam is occurring for no reason.
This is called a "phantom traffic jam," where a slowdown is initially caused by an accident but remains on the road for hours even after the accident has been cleared.
Model how a traffic jam (once it begins) can remain on the road for an extended period of time as an emergent phenomenon. What are the "small entities"? What are the local interaction rules between these small entities? You may get some inspiration from the video above, or imagine yourself as one of the small entities.
| In 2023, 87% of students got this right. |
Insect swarm
Relevant topic(s): 7.2 Emergent Phenomena
Answer the following questions about emergent phenomena among insects.
- Which of the following is the best example of an emergent phenomenon among insects?
In 2023, 75% of students got this right. - Eyespots scaring away predators from moths.
- Pheromone signaling between caterpillars.
- The feeding of royal jelly to a bee larva to create a queen.
- The building of an ant colony.
- A spider building a web.
- Ants are known for their complex social behaviors, such as forming trails to food sources, etc. Which of the following best describes the emergent phenomenon of swarm intelligence?
In 2023, 91% of students got this right. - Swarm intelligence is best described as being an emergent property of the genetic makeup of individual ants.
- Swarm intelligence is best described as being an emergent property of the lifespans of the ants.
- Swarm intelligence is best described as being an emergent property of the interactions of individual ants.
- Swarm intelligence is best described as being an emergent property of predators in the environment.
8.1 Orders of Understanding
European energy sources
Relevant topic(s): 8.1 Orders of Understanding
Below is a table of electrical energy sources for France and Germany in the year 2017 (source). For each of the four main categories (fossil fuel, nuclear, renewables, and waste), determine using the table whether it is a first, second, or third order cause of power production in France and Germany, respectively. (Recall that there can be multiple causes at the same order of contribution.)
| France 2017 (GWh) | Germany 2017 (Gwh) | |
|---|---|---|
| Fossil Fuel | 62,682 | 346,331 |
| Coal | 15,203 | 252,823 |
| Natural Gas | 40,500 | 87,685 |
| Oil | 6,979 | 5,571 |
| Nuclear | 398,359 | 76,324 |
| Renewables | 95,545 | 216,372 |
| Biofuel | 5,561 | 44,960 |
| Geothermal | 133 | 163 |
| Hydro | 55,135 | 26,155 |
| Solar | 9,585 | 39,401 |
| Tide | 522 | 0 |
| Wind | 24,609 | 105,693 |
| Waste Burning | 4,624 | 13,247 |
List each category term (once per country) under the correct order of understanding: Nuclear, Fossil Fuel, Renewables, Waste Burning.
France:
Germany:
|
The 🍌phone
Relevant topic(s): 8.1 Orders of Understanding
You're a manufacturer of banana-shaped satellite phones. The main components of the satellite phone currently have the following costs:
| Battery | $10.69 |
| Screen | $96.50 |
| Processor and memory | $910.10 |
| Sensors, holding material, and assembly | $1,050.88 |
| Triple camera | $103.50 |
| Miscellaneous | $20.01 |
Why is this phone so expensive? Give the first-order cause(s). Select all that apply.
- Battery
- Screen
- Processor and memory
- Sensors, holding material, and assembly
- Triple camera
- Miscellaneous
Drought in California
Relevant topic(s): 8.1 Orders of Understanding
Due to ongoing droughts, California needs to reduce its water usage in a sustainable way. For each of the following interventions, would it address a first, second, or higher order cause of water usage reduction?
- Replace all agricultural irrigation systems with new ones that are 50% more efficient
In 2022, 92% of students got this right. In 2023, 85% of students got this right. - First order
- Second order
- Higher order
- Replace people's lawns with native plants that require very little water
In 2022, 81% of students got this right. In 2023, 71% of students got this right. - First order
- Second order
- Higher order
- Put up billboards on all the highways saying "drink soda instead of water"
In 2022, 91% of students got this right. - First order
- Second order
- Higher order
- Put up billboards on all the highways saying "drink tap instead of bottled water." (Tap water uses less overall water than producing bottled water)
In 2023, 51% of students got this right. - First order
- Second order
- Higher order
- Distribute free "Water Reduction" bumper stickers
In 2022, 79% of students got this right. In 2023, 84% of students got this right. - First order
- Second order
- Higher order
- Replace all agricultural fields with drought resistant crops that require half as much water.
In 2023, 84% of students got this right. - First order
- Second order
- Higher order
Federal budget
Relevant topic(s): 8.1 Orders of Understanding
Here are some of the spending categories for the 2022 federal budget:
| Category | Amount |
|---|---|
| Education | $281 billion |
| Military/defense | $1,115 billion |
| Healthcare | $1,629 billion |
| Transportation | $141 billion |
For each of the following categories, choose whether or not they are first order causes of federal government spending.
- Education (First order/Not first order
In 2022, 96% of students got this right. - Military/defense (First order/Not first order)
In 2022, 83% of students got this right. - Healthcare (First order/Not first order)
In 2022, 99% of students got this right. - Transportation (First order/Not first order)
In 2022, 96% of students got this right.
Snackachusetts public health office
Relevant topic(s): 8.1 Orders of Understanding
Public health officials in the city of Snackachusetts want to get their citizens to have a healthier diet by eating more fruits, veggies, whole grains, and legumes. To do this, they gather a team of urban planners (and other experts) to estimate how many people would be exposed to each intervention. They also gather a team of psychologists (and other researchers) to do a test run of each intervention and see what percentage of people exposed to the intervention have their behavior meaningfully affected by it. The findings are summarized in the table below.
| Intervention Number | Proposed Intervention | Number People Exposed | Percent People Expected |
|---|---|---|---|
| 1 | Putting up billboards to advertise fancy grocery stores with really colorful pictures of fruits & veggies to whet the appetite. | 150,000 | 0.2% |
| 2 | Putting up billboards with food pyramids to educate the public about healthy eating habits. | 150,000 | 0.5% |
| 3 | Provide fair loans to small businesses to open up affordable grocery stores in low-income areas. | 62,000 | 82% |
| 4 | Supply school & local government work lunches with locally grown produce. | 18,000 | 40% |
| 5 | Supply free school & local government work lunches with locally grown produce. | 18,000 | 54% |
| 6 | Legally limit maximum working hours so that parents have time to cook meals at home. | 110,000 | 65% |
For each of the above interventions, would it be a first order (most impactful), second order (less impactful), or higher order (least impactful) impact on the average diet?
- Putting up billboards to advertise fancy grocery stores with really colorful pictures of fruits \& veggies to whet the appetite.
In 2023, 95% of students got this right. - 1st Order
- 2nd Order
- Higher Order
- Putting up billboards with food pyramids to educate the public about healthy eating habits.
In 2023, 92% of students got this right. - 1st Order
- 2nd Order
- Higher Order
- Provide fair loans to small businesses to open up affordable grocery stores in low-income areas.
In 2023, 89% of students got this right. - 1st Order
- 2nd Order
- Higher Order
- Supply school & local government work lunches with locally grown produce.
In 2023, 85% of students got this right. - 1st Order
- 2nd Order
- Higher Order
- Supply free school & local government work lunches with locally grown produce.
In 2023, 77% of students got this right. - 1st Order
- 2nd Order
- Higher Order
- Legally limit maximum working hours so that parents have time to cook meals at home.
In 2023, 75% of students got this right. - 1st Order
- 2nd Order
- Higher Order
8.2 Fermi Problems
Paper homework
Relevant topic(s): 8.2 Fermi Problems
- Suppose it is 2004, and every college student submits their homework on paper. Using Fermi estimation, calculate how much paper (in kg) is used for this purpose by all UC Berkeley students over the whole calendar year of 2004. (In the actual quiz, this sort of question will be marked by reasoning or process, not by the accuracy of your estimate.)
- Based on your own experience (or Fermi estimations), write down a first-order, a second-order, and a third-order source of paper use (by weight) by UC Berkeley students in 2004.
This is asking about the orders of contribution of various sources of paper use by students. In:
First order: Homework assignments
Second order: Toilet paper and paper napkins
Third order: Sticky notes
Jefe Pesos
Relevant topic(s): 8.2 Fermi Problems
Jefe Pesos, an (hypothetical) American billionaire, earned US$100 billion (that's US$100,000,000,000) in the first year of the Covid-19 pandemic. Suppose he could spend all this money. Would he have been able to pay for the basic food costs for the poorest 10% of children in the US, for whom hunger is a constant concern, for one year? Use Fermi estimation. (Please show your working and write down all your assumptions. You will not be marked by the accuracy of your estimates, but by the process of your calculation.)
| Example Answer:
US population: 350,000,000 Total cost of food for hungry children over one year: 350,000,000 x 0.25 x 0.1 x 10 x 365 ~ 32,000,000,000. Rubric: 1.5 points for listing individual factors/assumptions, 1.0 point for multiplying factors together, 0.5 for stating whether or not Jefe Pesos would be able to pay for this (student can say yes or no, but their conclusion should match the result of their calculation) Subtract .75 points for incorrect/incomplete factors or assumptions; subtract 0.5 points for calculation mistakes. |
| In 2022, 91% of students got this right. |
| In 2023, 91% of students got this right. |
How many text messages?
Relevant topic(s): 8.2 Fermi Problems
Using Fermi estimation, estimate how many instant messages (texts, DMs, etc.) are sent by all college students in the United States in one year. Show the elements you used, your numerical estimates for those elements, and how you combined them. You will be evaluated on the plausibility of your analysis, not the accuracy of your estimate.
| In 2022, 89% of students got this right. |
Fermi what, why, and when
Relevant topic(s): 8.2 Fermi Problems
- Which of the following statements best describes the process of Fermi estimation?
In 2023, 98% of students got this right. - Fermi estimation involves making exact calculations based on precise data.
- Fermi estimation involves comparing different data sets to find patterns and relationships.
- Fermi estimation involves using statistical models to analyze complex data.
- Fermi estimation involves making educated guesses based on reasonable assumptions.
- What is the main benefit of using Fermi estimation?
In 2023, 96% of students got this right. - It allows us to use our statistical knowledge learned in LS22.
- It provides a way to make estimates based on real data we find through analysis.
- It provides us with a way to estimate unknown values based on educated guesses.
- It requires teamwork which improves the classroom environment.
- Which of the following is not a good application of Fermi estimation?
In 2023, 79% of students got this right. - Coming up with a monthly budget for yourself.
- Sanity checking a headline about the amount of global methane emissions due to cow farts.
- Trying to estimate earnings for a new vegan ice cream you saw at the vegan ice cream store.
- Figuring out how long it would take to have a road trip to visit every waterfall in the United States.
9.1 Heuristics
Committing a fallacy most foul
Relevant topic(s): 9.1 Heuristics
Identify which of the following statements commit(s) the fallacy of base rate neglect.
- If someone has gone to prison, there is a 64% chance they will be arrested again in the 8 years after their release. This means that if a person is arrested, they are more often than not a former prisoner.
Base rate neglect This question seems to be especially hard. - A very accurate breathalyzer can detect every case of drunkenness. This means that if a driver is found to be "drunk" by the breathalyzer, they almost certainly are drunk and should be arrested.
Base rate neglect - Suppose a breast cancer test is 90% accurate (for both positive and negative identifications). If Yifan has breast cancer, then the test will most likely give a positive result.
Valid, no fallacy - A majority of animal bite injuries are caused by spiders. When a patient is presented to the doctor with an animal bite, the doctor should assume that the bite is most likely from a spider.
Valid, no fallacy
Baking bad
Relevant topic(s): 9.1 Heuristics
You meet Walter at a neighbor's house party. And he tells you that he is a high school teacher. Before you get to ask him anything, he starts bragging about all the fantastic pastries he's baked. You're wondering if Walter teaches chemistry. Doing Fermi problems in your head to distract yourself, you manage to estimate the following:
- One in ten high school teachers teach chemistry.
- Thirty percent of chemistry teachers would like baking.
- In order to calculate the probability that this braggadocios man is a chemistry teacher using Bayes' rule, which of the following pieces of information would you still need to estimate? (Your test is whether he likes baking.)
- Prior probability
- True positive rate
- True negative rate
- False negative rate
- None. We have all the information we need.
Fair inference?
Relevant topic(s): 9.1 Heuristics
- For each, say whether it commits base-rate neglect or is a fair inference.
- 98% of Vietnamese people have some level of lactose intolerance. Hong Thuy, our new flatmate from Vietnam, is therefore most likely lactose intolerant. (Base-rate neglect/Fair inference)
In 2022, 93% of students got this right. In 2023, 75% of students got this right. - Less than 1% of all pet bite injuries are due to snakes. If you have a pet snake, you are therefore very unlikely to be bitten by it. (Base-rate neglect/Fair inference)
In 2022, 78% of students got this right. In 2023, 78% of students got this right. - This test for colorectal cancer has a 12% false positive rate. If you don't have colorectal cancer, the test will likely report as negative. (Base-rate neglect/Fair inference)
In 2022, 63% of students got this right. In 2023, 61% of students got this right. - 60% of patients who are admitted to the hospital for a highly contagious (hypothetical) disease were already vaccinated against this disease. You are more likely to end up in the hospital if you are vaccinated than if you are not vaccinated. (Base-rate neglect/Fair inference)
In 2022, 96% of students got this right. We merged this and the next question in 2023.
- 98% of Vietnamese people have some level of lactose intolerance. Hong Thuy, our new flatmate from Vietnam, is therefore most likely lactose intolerant. (Base-rate neglect/Fair inference)
- For one of the statements above that commits base-rate neglect, name a piece of information about the base rates that would render the conclusion incorrect.
For (b), if there are far more owners of violent dogs than cats, then cats may account for a small percentage of pet bite injuries while still being very dangerous themselves. (It is easier to imagine replacing "cats" with "venomous snakes".) For (d), if there's a high vaccination rate amongst the general population, and the vaccine is not 100% effective, then there may still be more vaccinated hospitalizations despite the vaccine drastically reducing chances of severe illness. In 2022, 76% of students got this right. We merged this and the previous question in 2023 so that its answer wouldn't be dependent on getting the previous part right. - 60% of patients who are admitted to the hospital for a highly contagious (hypothetical) disease were already vaccinated against this disease. Sadie says you are therefore more likely to end up in the hospital if you are vaccinated than if you are not vaccinated.
Name a piece of information about the base rates that makes clear that Sadie is committing base-rate neglect.If there's a high vaccination rate amongst the general population, and the vaccine is not 100% effective, then there may still be more vaccinated hospitalizations despite the vaccine drastically reducing chances of severe illness. In 2023, 42% of students got this right.
Jill's blood test
Relevant topic(s): 10.1 Confirmation Bias, 9.2 Biases, 9.1 Heuristics
In a recent health check, Jill's blood test comes out positive for a rare disease, and she is now convinced that she has this terrible disease. Which one of the following heuristics or biases likely caused Jill to be more worried than she should be?
- Anchoring heuristic
- Availability heuristic
- Representative heuristic
- Base-rate neglect
- Confirmation bias, biased assimilation
- Confirmation bias, selective exposure
- Peak-end rule
| In 2022, 47% of students got this right. |
Pancreatic chance, or?
Relevant topic(s): 9.1 Heuristics
Suppose that scientists develop a new test to screen the general public for pancreatic cancer. After some testing they determine that the test has a 5% false positive rate and an 8% false negative rate. What additional information would be required to advise a patient on the results of their test?
| Response must include the base rate of pancreatic cancer in the population. It should also note that it is important to know how to interpret a positive or negative result: If someone is positive/negative, what is the chance that they have the disease? |
| In 2023, 54% of students got this right. |
9.2 Biases
Resisting conformity
Relevant topic(s): 9.2 Biases
What are two factors that make it more difficult to resist conforming to a group?
| Possible answers: Large number of people conforming. No dissenters. Identification with group. Lack of confidence the group is mistaken. (probably others are plausible too). |
Heuristics and biases
Relevant topic(s): 9.1 Heuristics, 9.2 Biases
In each of the following scenarios, which heuristic is most likely at play? (Availability heuristic, representativeness heuristic/conjunction fallacy, anchoring heuristic, peak-end rule)
- After watching a video compilation of escalator accidents, Kylie now has a fear of escalators, believing that they are prone to deadly mechanical failures.
Availability heuristic - In a government budget meeting, a politician insists that low-income people are not the source of criminal offences, but that more budget should instead be spent to solve a much bigger problem—crimes committed by poor migrant workers.
Representativeness heuristic/conjunction fallacy - While choosing an occupational path after his graduation, Andrew thinks, "wood logging sounds like a rather dangerous job, but it's nowhere near as dangerous as being a police officer, otherwise I would've heard about logging accidents more often on the news."
Availability heuristic
"What a slob"
Relevant topic(s): 9.2 Biases
A classmate shows up to class wearing sunglasses and a dirty sweatshirt. Her hair looks greasy, and when she speaks, her words are slurred. Your friend leans over and whispers to you, "What a slob. Somebody doesn't care about this class."
- What's the common psychological error your friend might be making? (Hint: the name for the common error ends with the word "error").
Fundamental Attribution Error (student does not need to provide explanation) In 2022, 94% of students got this right. In 2023, 89% of students got this right. - Explain the mistake as if to your friend. Why else could your classmate be wearing sunglasses and a dirty sweatshirt?
Sample Answer: The friend is making the Fundamental Attribution Error, assuming the reason for the student's behavior is who they are ("a slob") rather than their situation. They might be ill, or have been locked out the night before, or just been dumped, and the fact that they showed up anyway might indicate that they DO care about this class.
Rubric: 1 point for saying the friend is assuming it's something about the person (as opposed to the situation), .5 point for description of a plausible situational explanation.)In 2022, 80% of students got this right. In 2023, 77% of students got this right.
"Just World Fallacy"
Relevant topic(s): 9.2 Biases
Explain (1) what the "Just World Fallacy" is, and (2) how this helps explain the fundamental attribution error.
- Explanation of "Just World Fallacy"
The belief that "people get what they deserve and deserve what they get." In 2022, 95% of students got this right. - Explanation of FAE
If we assume that people get what they deserve, it suggests that people have control over their outcome and their results are a fair representation of their effort/character/etc. As such, it makes sense that we would then attribute people's actions to what kind of person they are instead of looking at the situation. In 2022, 81% of students got this right.
Crash landing
Relevant topic(s): 9.2 Biases
Participants in a study are split into two groups. One group is asked how concerned they are (on a scale from 1-10) that they would die in a plane crash while flying from New Zealand to New York on a nonstop flight, and they state that they are concerned at level 8. The other group is asked how concerned they are (on a scale from 1-10) that they would die in a car crash on their way home from work, and they state that they are concerned at level 3.
Why might we observe this effect in the participants? Briefly explain.
| The participants are using the availability heuristic. They can probably recall vivid news stories about plane crashes on international flights, but less about everyday fatal car crashes, even though one may be more likely to have a fatal car accident than a fatal plane crash. They have used the ease of recall of a type of events as a proxy for the likelihood of these events. |
FAULTy reasoning
Relevant topic(s): 9.2 Biases
In a 1983 study by Tversky and Kahneman, one group of participants assessed the likelihood of an earthquake hitting California next year and causing a massive flood, while another group assessed the likelihood of a massive flood somewhere in North America in the same time period. Participants judged the image of the earthquake and flood in California as more likely than a flood somewhere in North America, even though California is part of North America, and floods can originate from different causes.
Why might we observe this effect in the participants? Briefly explain.
| The participants have used the representativeness heuristic, which led to conjunction fallacy. They judged an earthquake and flood in California to be more likely than just a flood in North America, even though the latter is surely more likely, because they used the representativeness of such an event in California as a proxy for its high likelihood. |
| In 2023, 91% of students got this right. |
Spidey senses
Relevant topic(s): 9.2 Biases
Your roommate at Cal just watched a documentary about brown recluse spiders, whose bites are very painful and contain necrotic (flesh-eating) venom. Brown recluses are found in the eastern United States, where they typically live in dark enclosed places, including shoes. Your roommate now exclusively wears sandals—even if they're going hiking in an area where it's easy to stub a toe or sprain an ankle. Is your roommate making a fair inference? If not, what mental trap has your roommate fallen victim to?
| Student either writes "availability heuristic" or explains it with words. A proper explanation of base-rate neglect in this context may also be accepted. |
| In 2023, 76% of students got this right. |
Strict cutoff
Relevant topic(s): 9.2 Biases
You are on your long drive home from work, but you urgently need to use the bathroom. You drive a little faster than usual and honk at another driver blocking your way. Moments later, an aggressive driver cuts you off while honking at you. You angrily mutter to yourself, “What an awful and inconsiderate person! They should have their driver's license revoked!”
Which of the following cognitive biases are you falling victim to?
- Obedience bias
- Fundamental attribution error
- Peak-end rule
- Conformity
- Temporal discounting
10.1 Confirmation Bias
Scientific debate
Relevant topic(s): 10.1 Confirmation Bias
In 1993, Jonathan J. Koehler conducted a study, in which scientists on opposite sides of a scientific issue were asked to evaluate research reports on the issue on their quality (relevance, methodological soundness, clarity of presentation, etc.). They found strong evidence of that scientists engage in confirmation bias.
- What pattern of data would Koehler observe to demonstrate that the scientists engaged in confirmation bias?
Koehler would observe that the scientists who agree with the report's conclusions would more likely rate that report's quality to be higher. Those who disagreed would rate the same report's quality to be lower. (The scientists were asked to evaluate all aspects of quality, so they couldn't just answer one aspect but not the other.) In 2023, 79% of students got this right. - Which of the following is this an example of?
Biased assimilation. The scientists did not selectively read reports that confirmed their beliefs, but rather interpreted the reports' content to suit, or assimilate into, their prior beliefs. In 2023, 70% of students got this right. - Anchoring heuristic
- Availability heuristic
- Representativeness heuristic
- Base-rate neglect
- Biased assimilation
- Selective exposure
- Conformity
- Obedience
- Peak-end rule
Confirmation bias
Relevant topic(s): 10.1 Confirmation Bias
In 1997, Keith Stanovich and Richard West developed a measure called the Argument Evaluation Test (AET) for how well one can evaluate the quality of an argument independent of one's prior beliefs. They first asked individuals how much they agreed or disagreed with each of the 23 topic statements (concerning gun control, taxes, crime, etc.). Then, they asked the individuals to rate the quality of a series of arguments made by a fictional person, Dale, for or against the same 23 topics statements. Stanovich and West have found strong evidence for confirmation bias in this measure.
- What pattern of data would Stanovich and West observe to demonstrate that participants engage in confirmation bias?
Individuals on average rate arguments whose conclusion they agreed with higher than arguments whose conclusion they disagreed with. (The evaluation of quality is correlated with the level of agreement with the conclusion. In 2022, 97% of students got this right. - Is this an example of (select one):
In 2022, 91% of students got this right. - Biased assimilation
- Selective exposure
Selective exposure
Relevant topic(s): 10.1 Confirmation Bias
Which of the following is the best example of selective exposure?
- Searching "supermassive black holes" on Google Scholar and reading the first 5 papers to prepare for a research assignment on supermassive black holes.
- While arguing to your friend that social media causes bad mental health, you search "social media bad for mental health" to find data to support your argument.
- Wanting to know if it's worth donating to his favorite candidate in the upcoming election, Tim polls people at Sproul Plaza to find out who Berkeley residents plan to vote for.
- Rating an article called "The Benefits of Drinking Black Coffee" as being highly convincing because you like drinking your coffee black.
| In 2022, 91% of students got this right. |
Angry Thanksgiving
Relevant topic(s): 10.1 Confirmation Bias
You are sitting around the dinner table with your family, and a debate is sparked about the validity of rent control laws. Aunt Louise, who is generally against government regulations, decides to search “why rent control laws are bad” on her phone. Meanwhile, Uncle Krishna, who stands opposite to Aunt Louise politically, searches for “evidence for rent control laws.” They both present their findings, and no agreement is reached.
- What biases is this an example of?
Selective exposure - Even though you don't totally understand their arguments, you agree with your cousins, who are close to your age. They are in favor of rent control because they live in rent controlled apartments. What bias are you exhibiting?
Conformity - What bias would you exhibit if, instead, you choose to agree with Grandpa, because he is older and wiser. He doesn't like rent control because he is a landlord and it prevents him from making a larger profit?
Obedience
Astrological analysis
Relevant topic(s): 10.1 Confirmation Bias
In 1985, while at Berkeley Lab, Shawn Carlson conducted one of the first double-blind tests of astrology. The study involved 30 American and European astrologers considered by their peers to be among the best in the field. The astrologers interpreted natal charts (horoscope tables containing people's birth place/time and angular relations between various astrological objects) for 116 clients (that they did not meet face-to-face). To do this, the astrologers were given three real, but anonymized, personality profiles (called CPI profiles)—one from the client and two chosen at random—and had to identify which profile best matched the natal chart. Carlson found that the astrologers correctly matched the chart and profile one third of the time. Additionally, the pairs that the astrologers had the highest credence levels for were no more likely to be correct than the lower credence ones.

- Based on their prior experience, the participating astrologers predicted they would correctly match the natal charts and profiles at least 50% of the time. However, they performed no better than chance. What common psychological pitfall might the astrologers have been making that explains this discrepancy? Please be as specific as possible.
The intended answer is biased assimilation or any reasonable description of it. The idea is that the astrologers better remember the circumstances in which their predictions came true than the ones when they didn't. Selective exposure wouldn't be correct as it's unlikely the astrologers were more likely to take clients that they would happen to make good predictions for. In 2023, 79% of students got this right. - What aspect(s) of the experiment's design controlled for this psychological pitfall? How did said aspect(s) do so?
The double-blind part of the experiment. If the researchers had been aware of which profiles matched which natal charts then they might have accidentally tipped off the astrologers. In 2023, 93% of students got this right.
10.2 Blinding
Muon g-factor
Relevant topic(s): 10.2 Blinding
In a recent announcement by Fermi National Laboratory, scientists reported that their new measurement of a physical quantity called the "muon g-factor" significantly deviated from the theoretically predicted value. The computational and statistical analyses behind such a measurement are extremely complicated and took years to develop and verify. Before the announcement, some scientists hoped that the theoretically predicted value would be verified, while others hoped that a deviation could be shown, which would hint at an opportunity to develop a new theory of elementary particles. Which of the following approaches would reduce the bias that these scientists may introduce in the analysis due to their prior expectations?
- All involved scientists should agree on an overall method of analysis before collecting or processing the data.
- Collect and analyze a small set of preliminary data. If the value resulting from this preliminary data is significantly different from the theoretical value, then it suggests that further debugging of the analysis process is necessary.
- Add a small random number to all the collected data points before any analysis, so that the resultant value is different from the actual measured value by design. Only after all the analysis has been fully verified would this small random number be removed from the data points and the actual measured value produced through the analysis.
- Make and justify choices about which data points are outliers to be thrown out before seeing how those choices affect the final measured value.
- The various groups within the whole project (those building the experimental instruments, those doing the analysis, etc) are not allowed to communicate with each other until after all the data has been collected.
The intended answer is 1, 3, and 4.
|
Blind analysis
Relevant topic(s): 10.2 Blinding
Christa is trying to see which of two medications works better. She divides her patients into two groups, a treatment group and a control group. Which of the following variants (none of which are ideal) employs blind analysis?
| In 2022, 91% of students got this right. |
- Both Christa and the patients know who is in which group. Christa looks at the labelled data as she makes statistical choices, such as which outliers to exclude.
- Christa knows which patients are in which group, but the patients themselves do not know. Christa looks at the labelled data as she makes statistical choices, such as which outliers to exclude.
- Both Christa and the patients know who is in which group. However, Christa's data is not labelled when she makes choices during statistical analysis, such as which outliers to exclude.
- Neither Christa nor the patients know who is in which group. Christa looks at the labelled data as she makes statistical choices, such as which outliers to exclude.
- Neither Christa nor the patients know who is in which group. Christa wears a blindfold while she performs statistical analysis.
What makes blind analysis useful
Relevant topic(s): 10.2 Blinding
Which of the following factors makes blind analysis particularly useful/valuable? Select "Yes" if blind analysis would be very helpful, "No" if blind analysis is less important.
- The researcher has a strong prior belief in favor of a hypothesis. (Yes/No)
In 2022, 98% of students got this right. In 2023, 95% of students got this right. - The data analysis process is very simple. (Yes/No)
In 2022, 68% of students got this right. In 2023, 69% of students got this right. - The researcher is conducting confirmatory research. (Yes/No)
In 2022, 98% of students got this right. In 2023, 88% of students got this right. - The data analysis process is very complex. (Yes/No)
In 2022, 72% of students got this right. In 2023, 67% of students got this right. - The experimenter is conducting exploratory research. (Yes/No)
In 2022, 90% of students got this right. In 2023, 66% of students got this right. - The researcher does not have a strong prior belief about a hypothesis. (Yes/No)
In 2022, 94% of students got this right. In 2023, 91% of students got this right.
John's sleepy students
Relevant topic(s): 10.2 Blinding
Still concerned about drowsy students in plenary, John decides to take matters into his own hands and see if he can energize them. He gives half the students a caffeine pill and half the students a sugar pill, and wants to examine the energy levels of the various students. Propose 2 techniques that can reduce potential bias in the study.
| Examples:
Preregister how John will measure “energy levels” of students and what statistics he plans to perform. Double blind which pills are sugar and which pills are caffeine, and who gets the pills. Perform blind analysis of the results by giving the data to a researcher who doesn't know how the study was designed or what it should be measuring. |
How to blind?
Relevant topic(s): 10.2 Blinding
A team of ecologists are studying whether the number of bee colonies that undergo collapse reduced after the implementation of a recent environmental protection policy. They collected data for 3 years but did not observe a statistically significant reduction. After extending the study by another 2 years, they finally observed a statistically significant reduction, and they published the 5-year result. This is an example of p-hacking.
Which of the following techniques would be most effective at preventing this kind of pitfall?
- Blind analysis
- Double blind
- Preregistration
- Registered replication
- No blinding technique needed
| In 2023, 61% of students got this right. |
Solving with blind analysis
Relevant topic(s): 10.2 Blinding
Briefly (in 2-3 sentences) answer each of the following.
- What core problem is blind analysis intended to resolve and how does it do that?
Blind analysis prevents the researcher from finding a value that they already believe or have been primed to think may be true. Also get credit if they mention that it's to keep the researcher from falling into the trap of confirming prior results. In 2023, 97% of students got this right. - How can pre-registration help prevent p-hacking and the file drawer effect? (Your answer must address both.)
Pre-registration helps prevent p-hacking by: reporting hypotheses and intended analyses ahead of time which reduces post-hoc adjustments; prevents mid-experiment adjustments of sample size or procedure; ensures that all information is publicly available so that other researchers can check their work and a record of the project's development (aka everything is reported). In 2023, 90% of students got this right.
11.1 Pathological Science
Martian canals
Relevant topic(s): 11.1 Pathological Science
For a time in the late nineteenth and early twentieth centuries, some astronomers believed that Mars had an elaborate canal system. Elaborate maps of these canals were drawn and the canals were named by enterprising planeteers. Astronomer Percival Lowell argued that these canals were evidence for intelligent life, who had built the canals to irrigate the Martian landscape. However, various maps did not seem to match each other, and some astronomers (including several with particularly good telescopes) observed no canals at all. Moreover, evidence was growing that Mars was not warm enough to sustain liquid water. Acceptance among scientists sank, although Waldemar Kaempfert, an editor of Scientific American, continued to defend them as late as 1916.
Langmuir's criteria for pathological science:
- The effect is produced by a barely detectable cause, and the magnitude of the effect is substantially independent of the intensity of the cause.
- The effect is barely detectable or has very low statistical significance.
- Claims of great accuracy.
- Involving fantastical theories contrary to experience.
- Criticisms are met with ad hoc excuses.
- Ratio of supporters to critics rises to near 1:1, then drops back to near zero.
With these criteria, answer the following questions.
- It is not always clear when something is a case of pathological science. Name one of Langmuir's indicators (just write the number) that is present in this example and explain your answer.
- Name one of Langmuir's indicators (just write the number) that is NOT present in this example and explain your answer.
|
EmDrive
Relevant topic(s): 11.1 Pathological Science
EmDrive is a proposed device that generates thrust just by reflecting microwaves internally, surprisingly violating the conservation of momentum. It garnered widespread attention from the scientific and engineering community, many of whom have devoted resources to developing and validating such a device. In 2016, NASA's Jet Propulsion Laboratory announced that they observed a small apparent thrust from an EmDrive that they had constructed. The result was published after a year of peer review by 5 referees. However, other researchers had since failed to reproduce this result, and most did not see an effect larger than the experimental margin of error itself. In 2021, the 2016 study was found to have omitted to take into account the effect due to the Earth's magnetic field, rendering the result illusory.
Langmuir's criteria for pathological science:
- The effect is produced by a barely detectable cause, and the magnitude of the effect is substantially independent of the intensity of the cause.
- The effect is barely detectable or has very low statistical significance.
- Claims of great accuracy.
- Involving fantastical theories contrary to experience.
- Criticisms are met with ad hoc excuses.
- Ratio of supporters to critics rises to near 1:1, then drops back to near zero.
With these criteria, answer the following questions.
- It is not always clear when something is a case of pathological science. Name one of Langmuir's indicators (just write the number) that is present in this example and explain your answer.
2, 4, maybe 6. Any reasonable explanation. In 2022, 97% of students got this right. - Name one of Langmuir's indicators (just write the number) that is NOT present in this example and explain your answer.
1, 3, 5. Any reasonable explanation. In 2022, 96% of students got this right.
Gummy bear multivitamin
Relevant topic(s): 11.1 Pathological Science
Dr. Sharibo publishes a report arguing that half a gummy bear multivitamin taken once a week can drastically improve weight loss. His article outlines how he used a randomized control trial with 80 female participants to investigate the efficacy of this vitamin, finding that those that had the treatment said they lost on average 1 lb more weight than those in the control group. He relied on interviews from participants about their weight loss as evidence for the success of his treatment. When another scientist failed to replicate this study, Dr. Sharibo said it was because many of the other scientist's subjects also ate avocado which interfered with the vitamin. The vitamin is taken up by a fitness company, who then hires the researcher to create a line of supplements.
For each of Langmuir's criteria. Specify whether ("Yes") or not ("No") it applies to this scenario.
- The effect is produced by a barely detectable cause, and the magnitude of the effect is substantially independent of the intensity of the cause. (Yes/No)
In 2022, 71% of students got this right. - The effect is barely detectable, or has very low statistical significance. (Yes/No)
In 2022, 86% of students got this right. - Claims of great accuracy. (Yes/No)
In 2022, 51% of students got this right. - Involving fantastic theories contrary to experience. (Yes/No)
In 2022, 46% of students got this right. - Criticisms are met with ad hoc excuses. (Yes/No)
In 2022, 96% of students got this right. - Ratio of supporters to critics rises to near 50%, then drops back to near zero. (Yes/No)
In 2022, 96% of students got this right.
The bad science scale
Relevant topic(s): 11.1 Pathological Science
For each example, name what type of incorrect science it is. There is only one example of each. So, choose what fits best.
- The field of iridology claims that colors in different parts of the iris of the eye indicate ailments in different parts of the body. Blinded analysis of iris pictures by iridologists has failed to appropriately identify medical problems in patients. Yet some practitioners continue to market iridology readings because they believe their real-life perception of their efficacy supersedes experimental findings.
In 2023, 55% of students got this right. - Good Scientific Practice with Incorrect Results
- Poor Scientific Practice
- Pathological Science
- Pseudoscience
- Fraudulent Science
- Many years ago, cosmologist Dr. A did a careful calculation of the total mass of all galaxies in the universe based on the light they emitted, using the then-accepted assumption that most of the matter in galaxies emits light. After the discovery of dark matter, a type of matter that permeates all galaxies but does not emit light, Dr. A's calculation turned out to be based on an incorrect assumption and was thus wrong.
In 2023, 91% of students got this right. - Good Scientific Practice with Incorrect Results
- Poor Scientific Practice
- Pathological Science
- Pseudoscience
- Fraudulent Science
- A scientist publishes a paper but uses the letter "T" instead of real error bars on a graph to communicate uncertainty (true story). The "T" always used the same font size and this size did not necessarily match the actual error.
In 2023, 43% of students got this right. 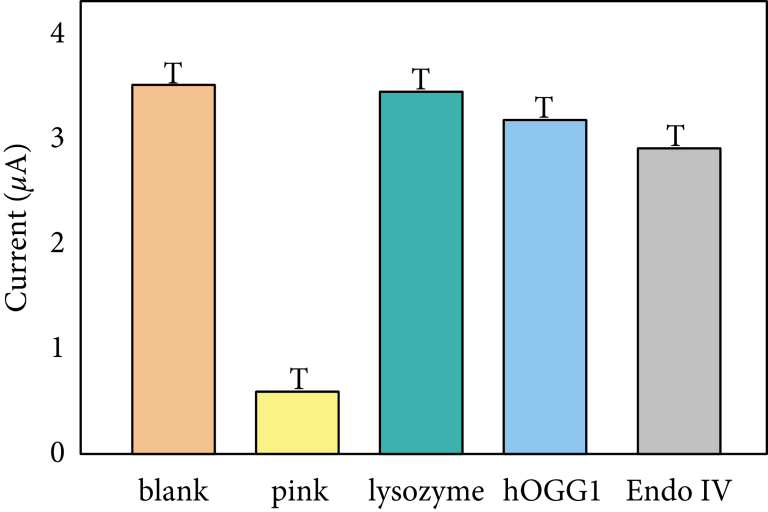
- Good Scientific Practice with Incorrect Results
- Poor Scientific Practice
- Pathological Science
- Pseudoscience
- Fraudulent Science
- Jerome found an surprising link between strawberries and the probability of getting Alzheimer's in mice. And it barely took any strawberries at all! When a colleague tried to repeat the finding, they failed to find a result. Jerome thinks it's probably just because the strawberries were from a different field. When the colleague tries again with the original strawberries, the results aren't really significant. It must be because of the weather that day, right? Jerome eventually publishes a paper claiming a link between strawberries and Alzheimer's that no one in his field believes because the results are barely statistically significant.
In 2023, 71% of students got this right. - Good Scientific Practice with Incorrect Results
- Poor Scientific Practice
- Pathological Science
- Pseudoscience
- Fraudulent Science
- A biologist is doing a study on aging and has some great preliminary results. However, there's a big conference coming and she wants to publish her paper beforehand, so she speeds through the follow-up experiments and doesn't perform as many replicates as she knows she should. Luckily, another group publishes a similar paper afterwards confirming her results.
In 2023, 65% of students got this right. - Good Scientific Practice with Incorrect Results
- Poor Scientific Practice
- Pathological Science
- Pseudoscience
- Fraudulent Science

11.2 When Is Science Suspect
Seuss' sneetches
Relevant topic(s): 11.2 When Is Science Suspect
- There are two communities of sneetches living in the same town—those with a star pattern on their bellies and those without. The star-bellied sneetches have done lots of research on starless sneetches. Of the following studies, knowing nothing else, which should you be most skeptical about?
In 2022, 90% of students got this right. - A study on the swimming speed of starless sneetches
- A study on the starless sneetches' speech sophistication
- A study on the starless sneetches' susceptibility to sun-sensitive sneezes
- A study on the starless sneetches' satisfaction with street sweeping services
- A study on the starless sneetches' sleep schedules
- Some star-bellied sneetches set out to study sneetches' susceptibility to superstitions. To measure superstition, the scientist sneetches give their subjects a trivia test on Friday the 13th (which is considered an unlucky day). Additionally, the scientists release black cats onto paths into the test building, have the subjects walk under a ladder to enter, and make them break a mirror all before taking the test. Then, without revealing the scores, the scientist sneetches ask the subject sneetches to guess how they did. If subject sneetches underestimate their actual performance, the scientist sneetches assume they did so out of superstition, because they believed they were "unlucky." What are some confounds the scientist sneetches' criteria may be measuring that disadvantage some sneetches but not others?
There are many possible confounds. Maybe starless and star-bellied sneetches have different superstitions. Maybe some sociological or socioeconomic status sets up some sneetches to be more confident than others. Maybe some sneetches studied Sense and Sensibility and Science and are better calibrated than other sneetches. Full credit for anything that identifies something in the design of the study that could somehow favor some sneetches over others. In 2022, 96% of students got this right.
Planet Flurpia
Relevant topic(s): 11.2 When Is Science Suspect
Planet Flurpia is inhabited by flurps and ruled over by the Flurp Overlord. The Flurp Overlord measures his underlings (also called the underflurp) on the basis of elasticity of their heads, position of ears, and a metric he calls "smudgeness." Smudgeness is intended to measure the brain waves of a given flurp.
- To measure their smudgeness, the Flurp Overlord asks the underflurp a random question whenever he sees them and sees how sassy their tone of response feels to him.
- To measure elasticity, the Flurp Overlord bounces them on their head from the same height dropped in the exact same way each time, then measures how high they bounce.
- To measure the position of their ears, the Flurp Overlord sings at the exact same volume from precise locations in a controlled environment, then asks if the underflurp can hear him each time.
Below are some lists of proposed problems with each of the metrics above. Select the list that best corresponds to the Flurp Overlord's metrics.
- List 1:
- Smudgeness: Validity
- Elasticity: Reliability
- Position of Ears: None
- List 2:
- Smudgeness: Reliability and Validity
- Elasticity: None
- Position of Ears: Reliability
- List 3:
- Smudgeness: None
- Elasticity: Validity
- Position of Ears: Validity
- List 4:
- Smudgeness: Reliability and Validity
- Elasticity: None
- Position of Ears: Validity
| In 2023, 48% of students got this right. |
12.1 Wisdom of Crowds and Herd Thinking
Twenty witnesses
Relevant topic(s): 12.1 Wisdom of Crowds and Herd Thinking
Twenty witnesses have been summoned to testify in court against a local construction company accused of illegally dumping waste into the local lake. They have all seen the whole act of dumping on the same day. While all twenty witnesses are in the courtroom, each witness is called to the stand and asked how much they estimate the amount of waste dumped in pounds. The court will then fine this company based on the average of the witnesses' estimates.
In terms of wisdom of crowds and herd thinking, what potential problem do you see with this method of estimation? Propose a better method of estimation from the witnesses that solves this problem.
| Later witnesses would be inclined to conform and agree with previously given estimates by earlier witnesses, biasing the final average. A better estimation method would be to have each witness secretly write down their own estimate, and then have the court average those numbers together, without the witnesses first talking with each other. |
Wisdom of crowds
Relevant topic(s): 12.1 Wisdom of Crowds and Herd Thinking
In which of the following scenarios would you expect the "wisdom of crowds" effect to have the largest positive impact on the result (i.e. to get closer to the true answer)? Estimating the heaviest recorded weight of a pumpkin in a large college classroom by having the students shout their own guesses one after another
- Estimating the number of traffic lights in San Francisco by selecting a random sample of the US population, having them discuss the question in groups, and then averaging their individual guesses
- Estimating the height of the empire state building by selecting a random group of university students, and having them discuss the question and agree on a collective guess
- Estimating the largest recorded weight of a tiger by selecting a random sample of the world population, and having them discuss the question in groups and agree on a collective guess
- Estimating the height of the tallest tree in the US by selecting a large, random sample of the US population and averaging their individual guesses
| In 2022, 89% of students got this right. |
Life without internet
Relevant topic(s): 12.1 Wisdom of Crowds and Herd Thinking
Michael wants to know the number of undergraduate students in the United States. Berkeley's internet is down, so he can't just look it up. Which of the following is the best way for him to make an estimate?
- Ask the 20 students on his floor to make independent guesses, and take the average.
- Ask the 20 students on his floor, and go with the estimate from the most confident person.
- Have the 20 students on his floor discuss together, and take the average of their guesses.
- Have the 20 students on his floor discuss together, and come to a consensus.
- Just estimate himself; he won't get any information by asking people who don't know any more than he does.
| In 2022, 92% of students got this right. |
Wisdom of herds
Relevant topic(s): 12.1 Wisdom of Crowds and Herd Thinking
In which cases of group decision making are we likely to get an accurate assessment (wisdom of crowds) or an inaccurate assessment (herd thinking)?
- Asking a classroom of LS22 students to each independently calculate the answer to a Fermi problem and then taking the average of the students' individual answers.
In 2023, 98% of students got this right. - Wisdom of Crowds
- Herd Thinking
- Sending out a text to Berkeley residents asking for their independent assessment of the value of a property in the Berkeley Hills. The true value is estimated by averaging over the individual answers.
In 2023, 97% of students got this right. - Wisdom of Crowds
- Herd Thinking
- Asking watchers of a particular cable news channel the likely outcome of a national election.
In 2023, 92% of students got this right. - Wisdom of Crowds
- Herd Thinking
- Asking members of the Reddit community \texttt{r/monarchists} what the likelihood is that the King of England is going to die in the next year.
In 2023, 93% of students got this right. - Wisdom of Crowds
- Herd Thinking
- Asking members of a jury out loud one at a time whether they think the defendant is guilty.
In 2023, 96% of students got this right. - Wisdom of Crowds
- Herd Thinking
12.2 Grill the Guest
This lesson is not explicitly tested on.
13.1 Denver Bullet Study
Advising Prince Kumperdinck
Relevant topic(s): 13.1 Denver Bullet Study
Suppose you are the advisor to Prince Kumperdinck of Glorin, who is trying to develop an agreement with the neighboring nation, Fuilder. The bakers of Glorin, who live close to the Glorin-Fuilder border, have been repeatedly disrupted by Fuilder's tendency to launch loud, bright fireworks late at night (this makes it difficult for the bakers to get up early to prepare the day's bread). The bakers of Glorin believe that the residents of Fuilder should only be allowed to use small, silent sparklers. The residents of Fuilder consider this solution inconceivable, because launching true fireworks each night is part of their cultural tradition and helps maintain the happiness of the nation. There is rising tension between the citizens of Glorin and Fuilder, as neither side is willing to back down.
Thinking back to your favorite class in advisor school, you recall a decision-making technique that involved integration of facts and values to come to a compromise in a similar scenario (the Denver Bullet Study). Prince Kumperdinck puts you in charge of implementing this technique. Your hope is that you can select a kind of firework that will make both parties optimally satisfied.
- Name two factors/features of the type of firework that have significant impact on its optimality as a solution to the current problem.
- Discuss who the relevant stakeholders and experts are in this situation and describe their roles in the decision-making process. (Note: you are not inventing a decision-making process. You are implementing the process discussed in class for integrating facts and values, exemplified by the Denver Bullet Study.)
- Explain how the technique produces/outputs a final decision on the optimal type of firework.
| Loudness of fireworks, brightness of fireworks, size of firework explosions, etc.
Stakeholders: residents of both nations. Experts: fireworks manufacturers. The stakeholders rate the importance of each of the factors/features/values to them. The experts rate each type of fireworks by how well they satisfy each of the values that the residents care about. For each factor/feature/value, the the importance score is multiplied by the satisfaction score, then summed over all factors/features/values. In other words, fact1*value1 + fact2*value2 + … |
High-speed rail
Relevant topic(s): 13.1 Denver Bullet Study
Suppose you are a government official tasked with developing a plan for a new high-speed railway system across your country. Several foreign countries, including China, France, Germany, and Japan, have already offered development plans using their own high-speed rail technology under significant foreign investment. You have also thought about developing the system entirely domestically to boost the national economy, but this will certainly take longer than foreign development plans.
You remember Prof. Campbell's lecture on the Denver bullet study from your days at Berkeley and hope to use it to make a decision by integrating facts and values.
- Name two factors or features of the high-speed rail plans that will play a significant role in the decision making process.
Total cost, speed, comfort for passengers, economic benefit, jobs added, environmental impact, etc - Name two stakeholders and two types of experts for this situation.
Stakeholders: construction workers, citizens living along the railway path. Experts: railroad engineers, economists. Or anything reasonable. - Briefly explain how the Denver bullet study technique produces or outputs a final decision on the optimal high-speed railway plan.
Stakeholders evaluate the relative importance of items in part (1), and experts independently evaluate how well each rail construction plan achieves each of the factors/features. The stakeholders' scores are multiplied with the corresponding experts' scores, and then summed up. (Final score is the average of the experts' scores, weighted by the stakeholders' scores.
Street design
Relevant topic(s): 13.1 Denver Bullet Study

The City of Berkeley is trying to decide what to do with a new street. Questions include how many lanes for drivers, whether to have parking on one or both sides, whether to have a bike lane, how wide to make the sidewalk, etc. Suppose you are on the City Council and want to inform the decision through a Denver Bullet Study style process.
- List three types of stakeholder likely to hold different priorities.
In 2022, 99% of students got this right. - List two questions you would like to ask the stakeholders.
In 2022, 73% of students got this right. - List two questions you would like to ask experts.
In 2022, 91% of students got this right.
Choose a vaccine
Relevant topic(s): 13.1 Denver Bullet Study
A viral infection causing chronic debilitating illness has been widespread among the population of a hypothetical country for many years. Several vaccines against this virus have recently been developed, but due to limited resources, the country's government has to decide on which one to purchase. The following is a table of the health experts' evaluation of each vaccine against each of the criteria (from 0 to 5, with 5 being the best).
| Affordability | Efficacy | Production Speed | |
|---|---|---|---|
| Veratropin | 3 | 4 | 2 |
| Nalosate | 3 | 5 | 3 |
| Kinefoxin | 4 | 1 | 4 |
The citizens of the country are then polled on how much value they place on each of the three criteria, from 0 to 5, with 5 being the most value. The averaged results, rounded to the nearest integer, are:
| Affordability | Efficacy | Production Speed |
|---|---|---|
| 3 | 5 | 2 |
Using the Denver bullet study method, which of the three vaccines should the government of this country purchase?
- Veratropin
- Nalosate
- Kinefoxin
| In 2022, 100% of students got this right. |
Which Windyville windmill winds up winning?
Relevant topic(s): 13.1 Denver Bullet Study
The town of Windyville is coming together about the design of a wind turbine that would be best for their town. The choices are: the Spinmill, the Chillmill, the Invisibill, the WINmill, and the Goldmill. The city council is inviting all residents of the town to an open session to deliberate the design. Using the Denver Bullet Study method, they asked experts to rate the various turbines on the following dimensions.
| Expert Ratings | Spinmill | Chillmill | Invisibill | WINmill | Goldmill |
|---|---|---|---|---|---|
| Energy Production | 5 | 1 | 3 | 5 | 2 |
| Bird Saving Capacity (speed & visibility) | 2 | 5 | 1 | 3 | 4 |
| Jobs Created (repairs, installation, etc.) | 4 | 1 | 3 | 2 | 5 |
The table shows expert evaluations of the different wind turbines on a scale of 1 to 5. 5 is the most highly rated and 1 is the least.
- List the question(s) you would want to ask the stakeholders in this study.
You would ask them for to give numerical value ratings on "Energy Production", "Bird Saving Capacity", and "Jobs Created". In 2023, 73% of students got this right. - How would you use the numerical data you collected to calculate a quantity to decide on the best wind turbine for everyone? Be specific or give an example.
Multiply the net value ratings with the expert evaluation scores for each wind turbine to get their overall scores. Then select the one with the highest final score. In 2023, 59% of students got this right.
13.2 Deliberative Polling
This lesson is not explicitly tested on.
14.1 Scenario Planning
Future of social media
Relevant topic(s): 14.1 Scenario Planning
Suppose you want to do a scenario plan on the future of social media in the next 10 years. Which pair of axes would be most useful/appropriate?
- How widespread internet access is vs. number of people using the internet
- Size of real world friend groups vs. rates of veganism
- Amount of time people tend to spend online vs. censorship of the internet
- Population density and popularity of Pokemon
- Humans on Mars vs. average length of hair
- Existence of some sort of government vs. balance between democratic and oligarchic governance of social media algorithms
Government cheese
Relevant topic(s): 14.1 Scenario Planning
You are a grocery tycoon in Snackachusetts. You decide to use a scenario planning strategy to identify the possible paths for the future of supermarkets to best position your grocery empire.
Consider "drivers" of the future of supermarkets, one of them being the degree to which the government clamps down on large supermarket monopolies. Come up with the other axis and draw a scenario planning diagram with labeled axes in the box below. Include a descriptive headline/indicator for each possible future scenario.
| "(left) Anti-trust is enforced → (right) Monopolies Reign". Your Y axis considers the locality of produce “(top) Local produce is preferred → (bottom) Global markets for food at all seasons”.
Top-Left - Something like Farmers' Markets are supreme Top-Right - Something like Large-scale/factory farming in every state Bottom-Left - Small grocery stores/bodegas source from around the world Bottom-Right - Amazon Grocery delivered by drones |
| In 2023, 84% of students got this right. |
14.2 Wrap Up
wut?
This lesson is not explicitly tested on.