
4.2 Finding Patterns in Random Noise: Difference between revisions
More actions
Winstonyin (talk | contribs) |
// via Wikitext Extension for VSCode |
||
| Line 85: | Line 85: | ||
'''COVID Origin''' | '''COVID Origin''' | ||
: What are the odds that COVID originated in a market where there ''just so happened to be'' a nearby major virology research institute ''and'' a worker went home sick just before the outbreak? Viral outbreaks are likely to occur in densely populated areas in major cities. Major cities tend to have major research institutes/hospitals that might have some virology component, especially in locations where there are higher risks of new viruses emerging like high population density and/or wet markets. Anything in the city could be considered nearby. Workers go home sick all the time. All in all, it is insufficient to conclude whether or not COVID originated from that specific lab based ''solely'' on the perceived unlikeliness of the circumstances. | : What are the odds that COVID originated in a market where there ''just so happened to be'' a nearby major virology research institute ''and'' a worker went home sick just before the outbreak? Viral outbreaks are likely to occur in densely populated areas in major cities. Major cities tend to have major research institutes/hospitals that might have some virology component, especially in locations where there are higher risks of new viruses emerging like high population density and/or wet markets. Anything in the city could be considered nearby. Workers go home sick all the time. All in all, it is insufficient to conclude whether or not COVID originated from that specific lab based ''solely'' on the perceived unlikeliness of the circumstances. | ||
{{Exemplary | |||
|{{Blockquote|I know it seems super meaningful that we ran into each other in Australia, when neither of us live in Australia, but I guess the chances of running into someone you know at some point, if you travel a lot and know a lot of people, are pretty high.}} | |||
{{Blockquote|There are many many cases of people making insanely correct predictions, so many that some people are convinced clairvoyance is real. But there are many more cases of people making totally wrong predictions. So it's probably just noise; with enough predictions, someone will be correct by luck.}} | |||
}} | |||
|-|Common Misconceptions= | |-|Common Misconceptions= | ||
Revision as of 21:54, 11 June 2026
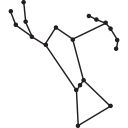
Humans are so good at identifying patterns that we often see them even when it is really noise in masquerade. When we think we have seen a pattern, how do we quantify the level of confidence correctly? We describe common pitfalls that lead to an overconfidence in an apparent pattern, some that even prey on the inattentive scientist!
The Lesson in Context
This lesson continues 4.1 Signal and Noise by elaborating on ways in which random noise can emulate signals (produce apparent patterns) in many different contexts. We introduce the idea of [math]\displaystyle{ p }[/math]-values to quantify the statistical significance of patterns and describe various tempting statistical fallacies we tend to make as laypersons or scientists, such as gambler's fallacy and [math]\displaystyle{ p }[/math]-hacking. We play a game in which students try to produce a random string of coin tosses by thought, which reveals that a truly random string in fact contains more apparent patterns than one intuitively expects. Two other activities also illustrate how spurious patterns are in fact expected to arise from random noise.
Earlier Lessons
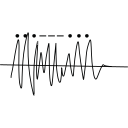
- A signal is a particular pattern of the data that we are seeking, while noise is something that introduces uncertainty or error into the measurement of that data, in a way that sometimes produces spurious signals.
- [math]\displaystyle{ p }[/math]-values are one way to quantify how statistically significant a measured signal is compared to the noise. It is defined as the probability that the measured signal is produced entirely by random noise alone even when the underlying cause of a signal is absent.
Later Lessons

- Cognitive heuristics and biases such as confirmation bias may mislead us into seeing a pattern in random data where there is none.
- [math]\displaystyle{ p }[/math]-hacking is one source of pathological science, where authors fail to disclose the measurements in which the supposed signal is not observed, thereby falsely inflating the statistical significance of the reported signal.
Takeaways
After this lesson, students should
- Understand that people tend to see any regularity as a meaningful pattern (i.e., see more signal than there is), even when "patterns" occur by chance (i.e. are pure noise).
- Recognize cases of the Look Elsewhere Effect in daily life when you hear phrases such as "what are the odds".
- Recognize and explain the flaw in scenarios in which scientists and other people mistake noise for signal.
- Resist the opposing temptations of both the Gambler's Fallacy (the expectation that a run of similar events will soon break and quickly balance out, because of the assumption that small samples resemble large samples) and the Hot-hand Fallacy (the expectation that a run will continue, because runs suggest non-randomness).
- (Data Science) Describe the difference between the effect size (strength of pattern) and credence level (probability that the pattern is real), and identify the role each plays in decision making.
People underestimate the frequency of apparent patterns produced by randomness, leading to over-perception of spurious signal much more frequently than people account for. Events that are just coincidental are much more likely than most people expect.
Look Elsewhere Effect
Since humans are so good at identifying noise that looks like signals, it is easy to find and fall victim to this even if it doesn't seem like we're asking too many questions. The look elsewhere effect can be avoided by clearly stating the questions you're asking before seeing the data.
Things that Cause the Look Elsewhere Effect
- Asking too many questions of the same data set, reporting only statistically significant results.
- Asking the same question of multiple data sets, reporting only statistically significant results.
- Running a test or similar tests too many times, reporting only statistically significant results.
- The effect also occurs in everyday life, e.g. when one looks at a whole lot of phenomena and only takes note of the most surprising-looking patterns, not properly taking into account the larger number of unsurprising patterns/lack of pattern.
[math]\displaystyle{ p }[/math]-hacking
A [math]\displaystyle{ p }[/math]-value cutoff of .05 thus indicates that, 1 out of 20 analyses of pure noise would discover a spurious signal. [math]\displaystyle{ p }[/math]-hacking is statistically problematic but more often a result of misunderstanding than deliberate fraudulence.
Common Techniques for [math]\displaystyle{ p }[/math]-hacking
- Running different statistical analyses on the same dataset and only reporting the statistically significant ones.
- Analyzing multiple DVs and only reporting the statistically significant ones.
- Gradually increasing the sample size until the [math]\displaystyle{ p }[/math]-value falls below .05.
[math]\displaystyle{ p }[/math]-hacking sounds malicious. But, it's easy to do inadvertently even as a professional researcher!
HARKing
Gambler's Fallacy
Hot-hand Fallacy
These two fallacies lead in opposite directions, but are both a result of the misconception that small samples (or short runs) will resemble large samples (or long runs), forgetting about statistical uncertainty. The Gambler's Fallacy arises because people assume a small sample will look like a large sample, such that a run of e.g. Tails will quickly be balanced out by Heads. The Hot Hand Fallacy arises when a run (e.g. of Tails) makes people think the sequence isn't truly random, but an effect of skill or luck that will continue. Both fallacies arise because long runs are commoner in random sequences than people expect.
File-drawer Effect
Mr. Goxx
- A hamster that actively manages a cryptocurrency portfolio by running in his "intention wheel" to determine what he's buying/selling and then goes through either a "BUY" or "SELL" decision-tunnel to decide what he's doing with it. As of october 2021, his portfolio was up nearly 30% from june when he started trading crypto. His decisions are streamed live on Twitch.
Cold Reading in a Crowd
- A medium shouts out to a crowd somewhat common names, such as William and Butler, and common ailments such as, "heart problem" or "passed in their sleep". It is very likely that a couple people in the crowd can match a majority of these features to someone in their life, making the claims seem impressively accurate (seemingly small [math]\displaystyle{ p }[/math]-value), but this ignores all the other members of the audience who could not match any of the claims. This is an illustration of [math]\displaystyle{ p }[/math]-hacking.
[math]\displaystyle{ p }[/math]-hacking Through Incrementing Sample Size
- "We conducted the study on 1000 participants, and our [math]\displaystyle{ p }[/math]-value is just slightly above 0.05. Let's recruit another 20 participants to see if our [math]\displaystyle{ p }[/math]-value can dip under 0.05." If they keep increasing their sample size by 20 each time, the [math]\displaystyle{ p }[/math]-value will fluctuate just from chance alone, possibly dipping below 0.05 even if there isn't a real signal. This is equivalent to only selecting a subsample of the data that would confirm a hypothesis, omitting that an even larger sample would have rejected the same hypothesis.
"What are the odds!
- Every time you hear this, be suspicious. The odds are probably higher than you'd think, if you take into account all the similar events that didn't include anything surprising.
Running Into Someone
- You're on vacation in London and you run into an old friend that was also there on vacation. It may be unlikely that this specific friend came to this exact spot on vacation. But, you're bound to run into someone you've met before on some trip at some point, especially if you associate with people likely to visit similar places.
COVID Origin
- What are the odds that COVID originated in a market where there just so happened to be a nearby major virology research institute and a worker went home sick just before the outbreak? Viral outbreaks are likely to occur in densely populated areas in major cities. Major cities tend to have major research institutes/hospitals that might have some virology component, especially in locations where there are higher risks of new viruses emerging like high population density and/or wet markets. Anything in the city could be considered nearby. Workers go home sick all the time. All in all, it is insufficient to conclude whether or not COVID originated from that specific lab based solely on the perceived unlikeliness of the circumstances.
Exemplary Quotes
“I know it seems super meaningful that we ran into each other in Australia, when neither of us live in Australia, but I guess the chances of running into someone you know at some point, if you travel a lot and know a lot of people, are pretty high.”
“There are many many cases of people making insanely correct predictions, so many that some people are convinced clairvoyance is real. But there are many more cases of people making totally wrong predictions. So it's probably just noise; with enough predictions, someone will be correct by luck.”
The Look Elsewhere Effect means that more data leads to more misinterpretations, or "too much data is bad."
More separate analyses someone runs, the better their analysis will be.
Wow, that was such a striking coincidence! It must have some hidden significance.
Additional Content
You must be logged in to see this content.